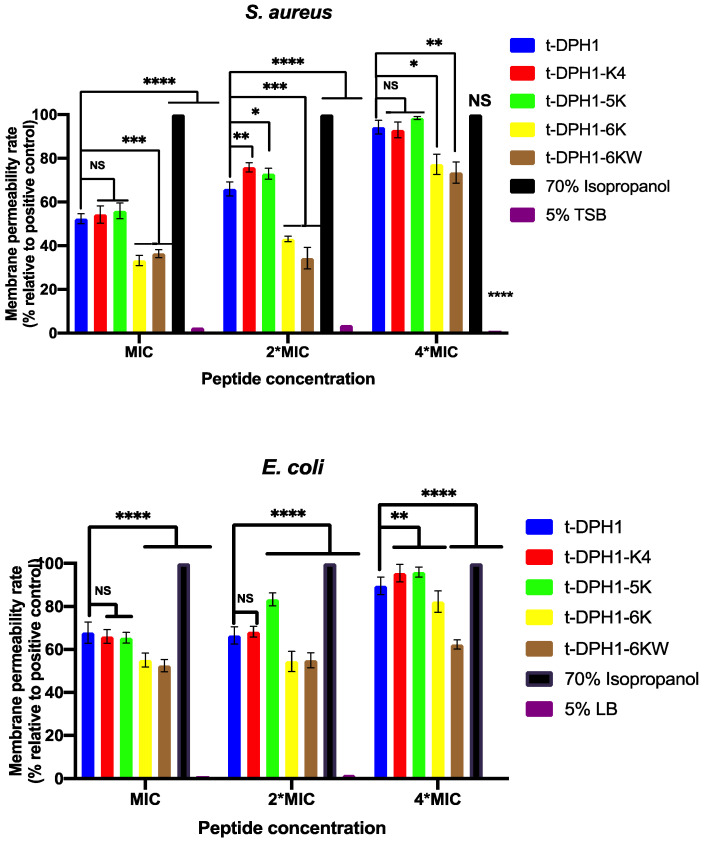
Figure 6.
The destruction of S. aureus and E. coli cell membranes at concentrations of MIC, 2*MIC and 4*MIC. Bacteria treated with 70% isopropanol and 5% TSB or LB served as the positive control and negative control groups. The data were analysed by multiple t-tests comparing the membrane permeability rate of different peptides and control groups with that of t-DPH1 in the same concentration, and the significance is indicated by asterisks (* p < 0.05; ** p < 0.01; *** p < 0.001; **** p < 0.0001) and NS represented no significant difference. The error bar represents the SD of nine replicates.

