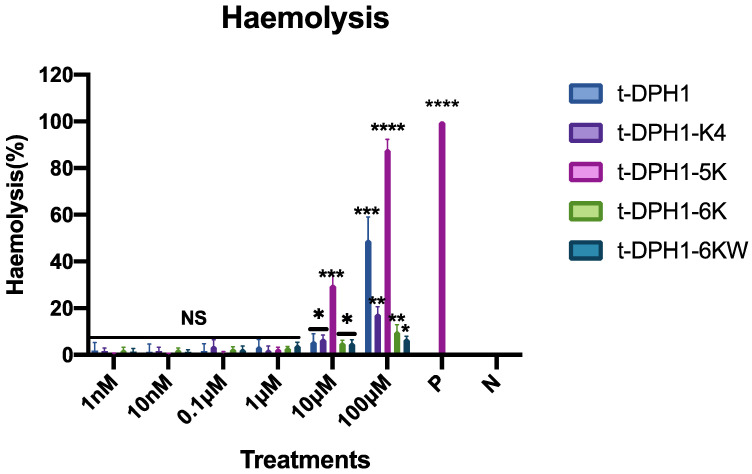
Figure 9.
Haemolytic activities of t-DPH1 and its analogues against horse red blood cells. ‘P’ represents the positive control group, and ‘N’ represents the negative control group, 0.1% Triton X-100 and PBS, respectively. The data were analysed by two-way ANOVA by comparing the haemolysis rates of different peptides in a series of concentrations with the negative control group. The significance is demonstrated with asterisks (* p < 0.05; ** p < 0.01; *** p < 0.001; **** p < 0.0001), and NS means there is no significant difference. The error bar indicates the SD of nine replicates.

