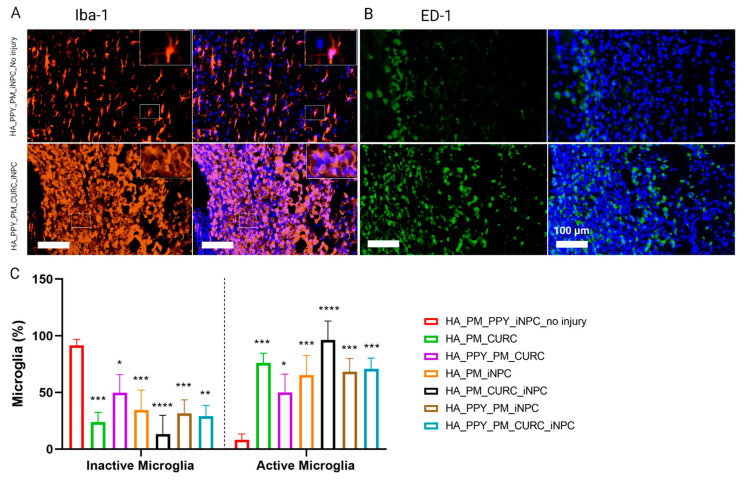
Figure 8.
Evaluation of the neuroinflammatory reaction at the early stages after SCI. (A) Immunofluorescent staining for Iba-1 (microglial marker, orange) and (B) ED-1 (macrophage marker, green). Scale bar: 100 µm. (C) Quantification of inactive and active microglia identified by the morphological appearance of Iba-1 expressing cells. Data represented as mean ± SD, n = 3 (* p < 0.05, ** p < 0.01, *** p < 0.001, **** p < 0.00001).

