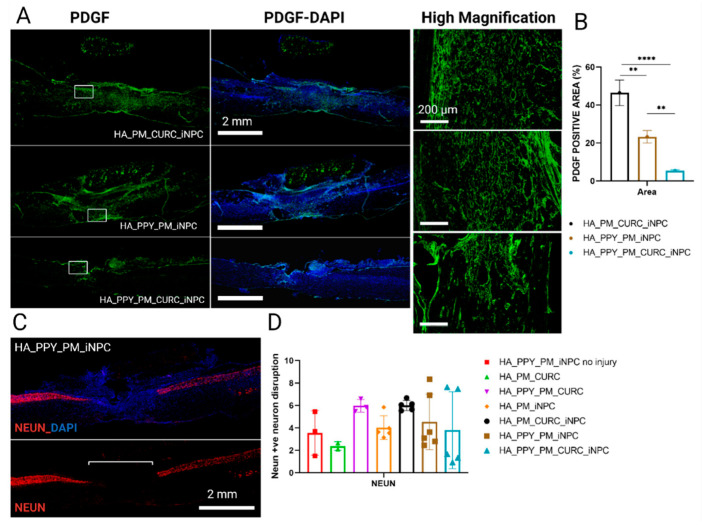
Figure 9.
Quantitative and qualitative analysis of PDGF and NeuN expression at the site of injury. (A) Immunofluorescent staining for PDGF (green) at low magnification (left panels, including merged images with DAPI staining), Scale bar: 2 mm and a selected area at high magnification (right panel), Scale bar: 200 µm. (B) Quantification of PDGF positive expression area. Data represented as mean ± SD by one-way ANOVA with Tukey’s multiple comparison test (** p < 0.01, **** p < 0.0001). (C) Representative image of NeuN (red) and DAPI staining. Scale bar: 2 mm. (D) Quantification of the disruption of the NeuN-positive neuron area at the injury site. Data represented as mean ± SD by one-way ANOVA with Tukey’s multiple comparison test, n = 3.

