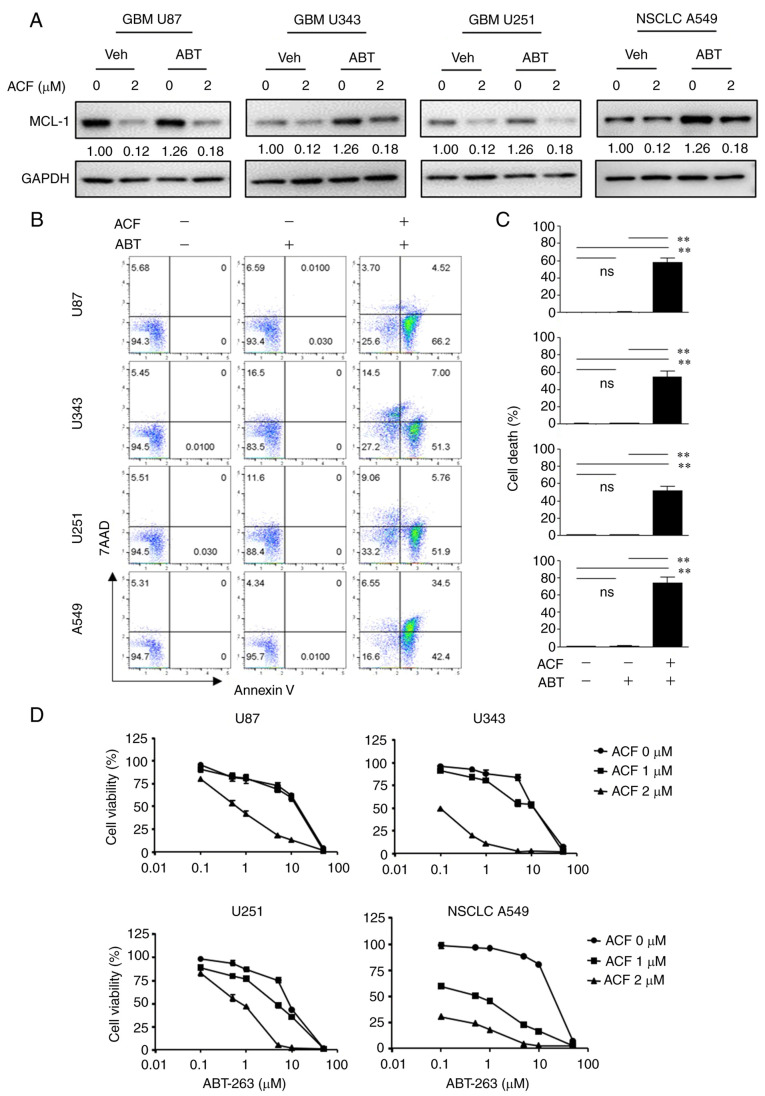
Figure 6.
ACF overcomes the therapeutic resistance of ABT-263. (A) U87, U343, U251 and A549 cells were treated using ABT-263 and were incubated with 0 or 2 µM ACF for 24 h, and the expression of MCL-1 was detected using western blotting. (B) U87, U343, U251 and A549 cells were treated with ACF (2 µM) and/or ABT-263 (0.5 µM) for 24 h and apoptosis was evaluated using Annexin V and 7-AAD staining followed by FACS. (C) Quantitative analysis of the percentage of cell death (Annexin V+/7-AAD−). Data are presented as the means ± standard deviation from two independent experiments. (D) U87, U343, U251 and A549 cells were treated with indicated concentrations of ACF and ABT-263 and cell viability was determined using the sulforhodamine B assay. **P<0.01 compared with non-treated and ABT alone treated cells. ACF, acriflavine; 7-AAD, 7-amino-actinomycin D; MCL-1, myeloid cell leukemia sequence 1.

