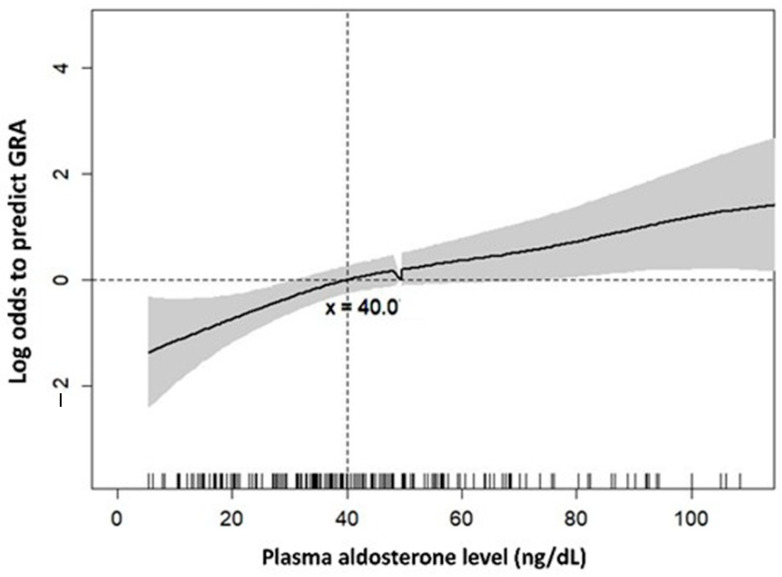
Figure 1.
Generalized additive model (GAM) plot for plasma aldosterone and log odds to predict GRA. Figure 1 depicts the GAM plot for the probability of plasma aldosterone against GRA-positive patients, incorporating the subject-specific (longitudinal) random effects expressed as the logarithm of the odds. The probability of outcome events was constructed with age-adjusted variables over the range of data, and plasma aldosterone = 40. The dashed lines represent approximated pointwise 95% CI. Dotted curves indicate 95% CIs for the smoothed hazard.

