Figure 1.
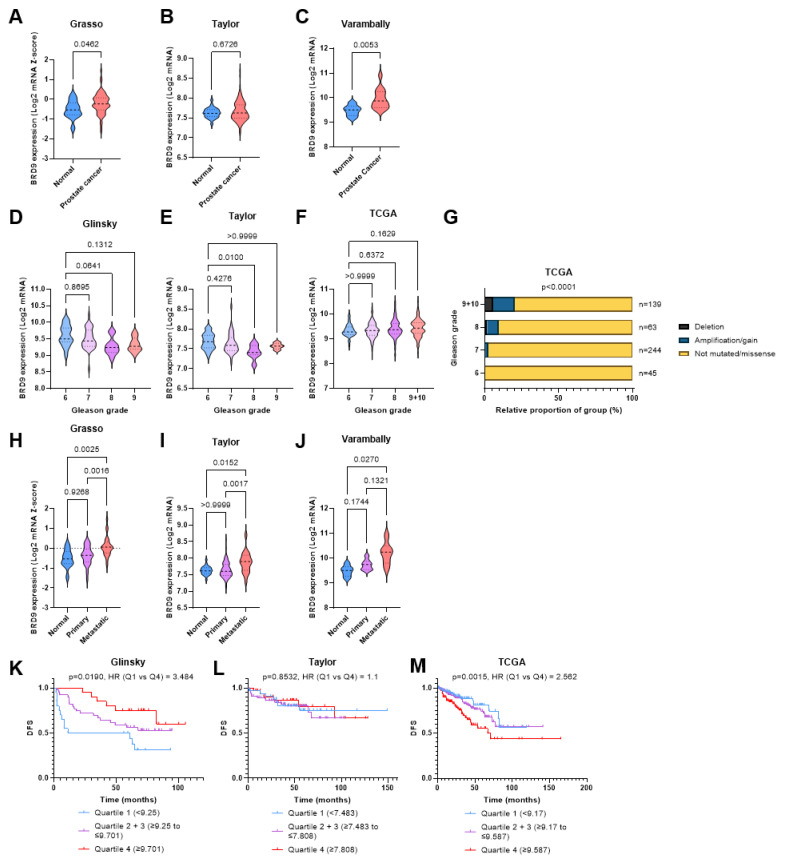
BRD9 as a diagnostic and prognostic biomarker in cancer omics cohorts. (A) Violin plot showing BRD9 expression in normal and PCa patients in the Grasso cohort. p-value was obtained using Welch’s t-test. (B) Violin plot showing BRD9 expression in normal and PCa patients in the Taylor cohort. p-value was obtained using Mann-Whitney U test. (C) Violin plot showing BRD9 expression in normal and PCa patients in the Varambally cohort. p-value was obtained using Welch’s t-test. (D) Violin plot showing how BRD9 expression varies with Gleason grade in the Glinsky cohort. p-values were obtained using Dunnett’s T3 post-hoc test. (E) Violin plot showing how BRD9 expression varies with Gleason grade in the Taylor cohort. p-values were obtained using Dunn’s post-hoc test. (F) Violin plot showing how BRD9 expression varies with Gleason grade in the TCGA cohort. p-values were obtained using Dunnett’s T3 post-hoc test. (G) Stacked bar chart showing BRD9 mutation distribution at different Gleason grades and the number of patients at each grade in the TCGA cohort. p-value was obtained via Fisher’s exact test using the Monte Carlo simulation. Grades 9 and 10 have been combined due to an n = 4 sample size at grade 10. (H) Violin plot showing how BRD9 expression varies with cancer progression in the Grasso cohort. p-values were obtained using Dunn’s post-hoc test. (I) Violin plot showing how BRD9 expression varies with cancer progression in the Taylor cohort. p-values were obtained using Dunn’s post-hoc test. (J) Violin plot showing how BRD9 expression varies with cancer progression in the Varambally cohort. p-values were obtained using Dunnett’s T3 post-hoc test. (K) DFS shown via KM survival curve in the Glinsky cohort. p value was obtained from a Mantel-Cox test and HR was calculated from a cox regression model by comparing the highest and lowest quartiles of BRD9 expression. (L) DFS shown via KM survival curve in the Taylor cohort. p value was obtained from a Mantel-Cox test and HR was calculated from a cox regression model by comparing the highest and lowest quartiles of BRD9 expression. (M) DFS shown via KM survival curve in the TCGA cohort. p value was obtained from a Mantel-Cox test and HR was calculated from a cox regression model by comparing the highest and lowest quartiles of BRD9 expression. Gleason grade (1–5) increases with more aggressive and less well-differentiated cancer. Overall grade (6–10) is the sum score of the two most prevalent grades in the sample. Y axis scales on violin plots vary due to experimental variation.

