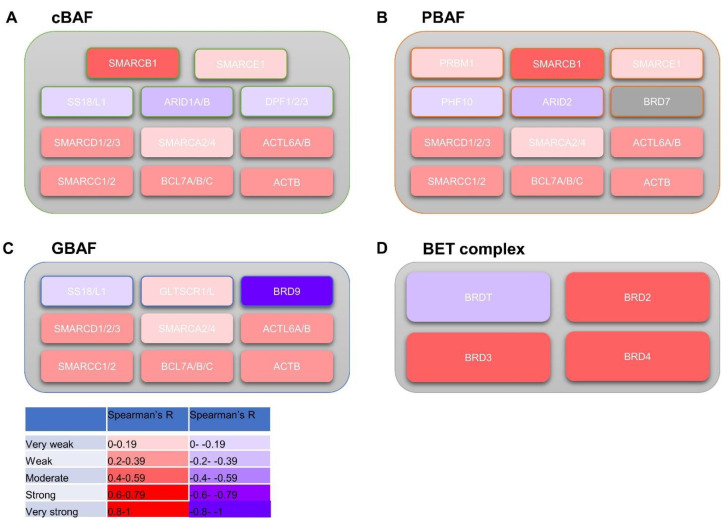
Figure 4.
An overview of BRD9 correlation with genes composing the SWI/SNF and BET complexes. Heatmap diagrams showing mean significant Spearman’s R BRD9 correlation from datasets with gene subunits composing SWI/SNF subcomplexes (cBAF, PBAF, GBAF) and BET complex. (A) Heatmap diagram showing mean significant Spearman’s R BRD9 correlation from datasets with gene subunits composing the cBAF subcomplex. (B) Heatmap diagram showing mean significant Spearman’s R BRD9 correlation from datasets with gene subunits composing the PBAF subcomplex. (C) Heatmap diagram showing mean significant Spearman’s R BRD9 correlation from datasets with gene subunits composing the GBAF subcomplex. SWI/SNF diagrams adapted from Centore et al.’s Figure 1 [15]. Image created using Microsoft PowerPoint. (D) Heatmap diagram showing mean significant Spearman’s R BRD9 correlation from datasets with gene subunits composing the BET complex.

