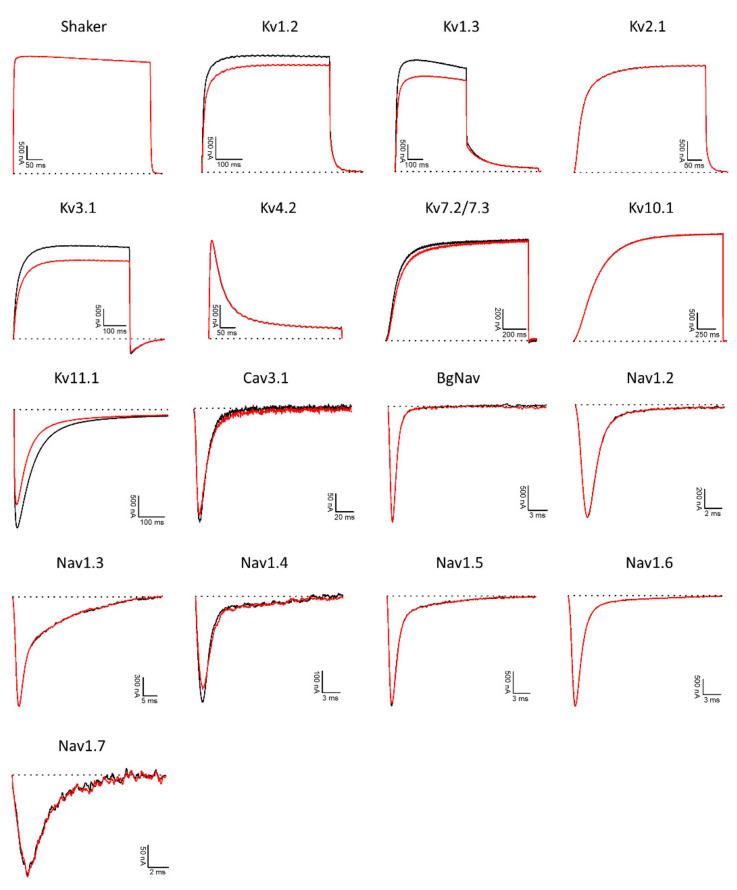
Figure 6.
Electrophysiological screening of IlO1_i1 (8 µM) on potassium (KV), sodium (NaV), and calcium (CaV) channels. The black lines represent the controls, while the red lines indicate the current obtained after the addition of the peptide. Dotted lines represent zero current level. The graphs illustrate the effects obtained in a series of at least three independent experiments (n ≥ 3).

