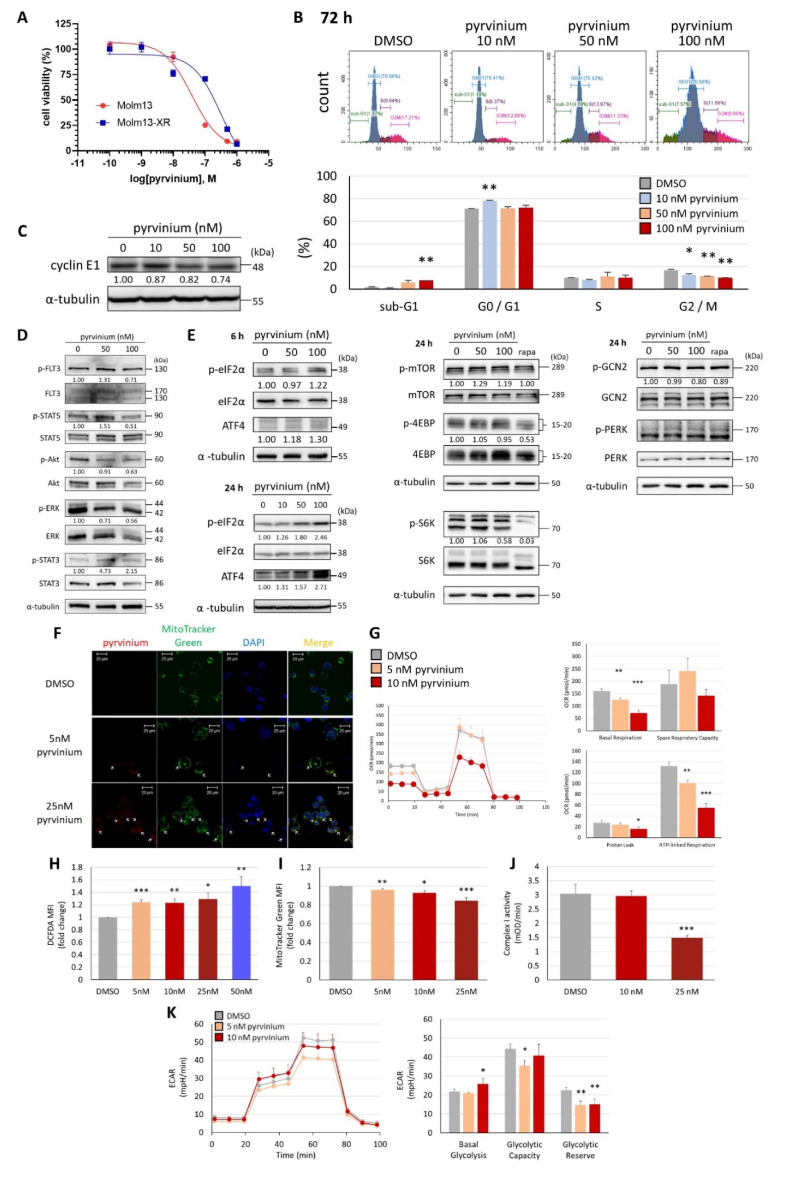
Figure 5.
In vitro anti-leukemic effect of pyrvinium in Molm13-XR cells. (A) Half maximal inhibitory concentration of pyrvinium after treatment for 72 h, evaluated by the MTS assay in Molm13, and Molm13-XR cells. (B) Different populations of Molm13-XR cells upon exposure to pyrvinium for 72 h were evaluated by flow cytometry using propidium iodide staining. * p < 0.05, ** p < 0.01, *** p < 0.001 vs. DMSO. (C) Western blot analysis of Molm13-XR cells treated with DMSO, 50 nM pyrvinium, or 100 nM pyrvinium for 24 h and probed with an anti-cyclin E1 antibody. (D) Western blot analysis of indicated proteins in Molm13-XR cells exposed to drugs for 4 h. (E) Western blot analysis of Molm13-XR cell lysates probed with anti-p-eIF2α, eIF2α, and ATF4 antibodies for 6 h (E, upper left) or 24 h (E, lower left); or probed with anti-p-mTOR, mTOR, p-4EBP, 4EBP, p-S6K, S6K, p-GCN2, GCN2, p-PERK, PERK antibodies for 24 h (E, middle and right). α-Tubulin was used as a loading control. Representative Western blots of three independent experiments are shown. Values represent the fold change with respect to the DMSO control group after normalization with α-tubulin. (F) Confocal microscopy images demonstrating that pyrvinium was co-localized with mitochondria in Molm13-XR cells. Arrows indicate the mitochondria overlapped with pyrvinium. (G) Seahorse Cell Mito Stress Test was performed to measure basal respiratory, spare respiratory capacity, proton leak, and the ATP-linked respiratory in Molm13-XR cells treated with 5 nM, or 10 nM pyrvinium for 24 h, compared with those in cells treated with DMSO. (H) Intracellular reactive oxygen species levels were measured by DCFH-DA staining; (I) Mitochondria mass was determined by MitoTracker Green staining coupled with flow cytometry in Molm13-XR cells treated with indicated concentrations of pyrvinium for 24 h. (J) Mitochondria respiratory chain complex I activity was measured after treatment with DMSO, 10 nM pyrvinium or 25 nM pyrvinium for 24 h. (K) Seahorse Glycolysis Stress Test was performed to measure basal glycolysis, glycolytic capacity, and glycolytic reserve after pyrvinium or DMSO treatment for 24 h. * p < 0.05, ** p < 0.01, *** p < 0.001 vs. DMSO.

