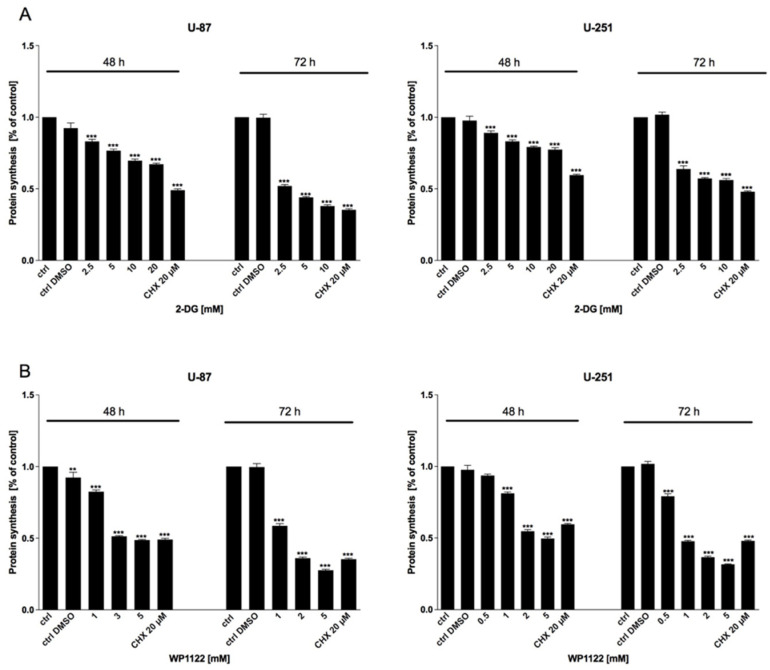
Figure 3.
SRB assay showing protein synthesis of U-87 and U-251 cells after 48 and 72 h treatment with various concentrations of (A) 2-DG (0.5–20 mM) and (B) WP1122 (0.25–5 mM). As a positive control, CHX (20 μM) was used. Significant differences between the treatment means and control values are indicated by ** p < 0.01 and *** p < 0.001.

