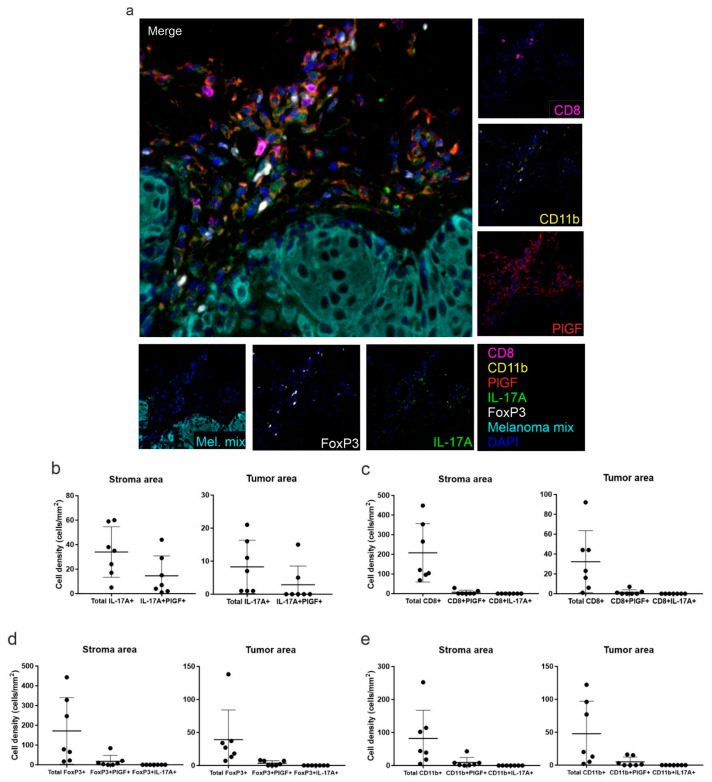
Figure 4.
Multiplex immunofluorescence analysis of the second panel. (a) Representative 7-color multispectral image of the second multiplex immunofluorescence panel. Markers and color codes are indicated in the figure. Original magnification 20×. Single marker assessment is reported in the small pictures around the merged image. Density (number of cells/mm2) of total IL-17A+ and IL-17A+PlGF+ cells (b), total CD8+ T lymphocytes, CD8+PlGF+ and CD8+IL-17A+ cells (c), total FoxP3+ T regulatory cells, FoxP3+PlGF+ and FoxP3+IL-17A+ cells (d), and total CD11b+, CD11b+PlGF+ and CD11b+IL-17A+ cells (e) was quantified in the stroma (left panels) and in the intra-tumoral (right panels) regions. Each dot represents the mean of all acquired fields from the same tissue sample (at least 20 fields at magnification 20× for each stained slide).

