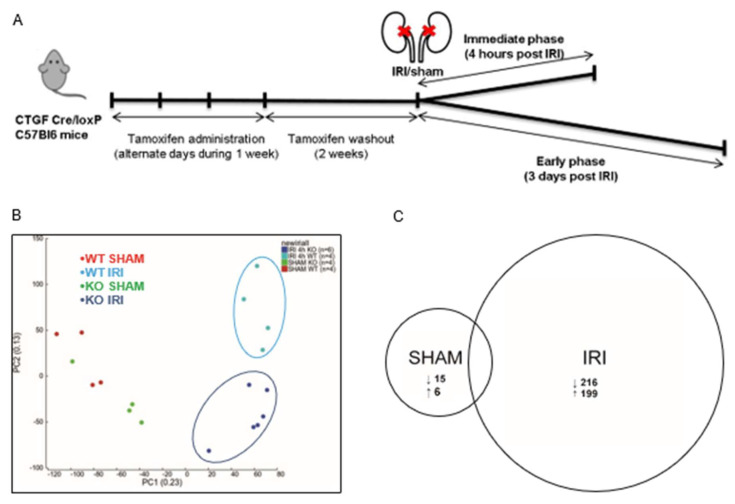
Figure 1.
CCN2 regulated gene transcription 4 h after renal IRI. (A) Time course of the IRI mouse model; (B) principal component analysis plot of sham and IRI RNA sequence data in both WT and CCN2 KO genotypes showed clustering of WT IRI, CCN2 KO IRI, and sham groups but no clustering within the sham group; (C) pairwise comparisons of RNA sequence data of sham and IRI data in both WT and CCN2 KO genotypes showing the amount of differentially expressed genes.

