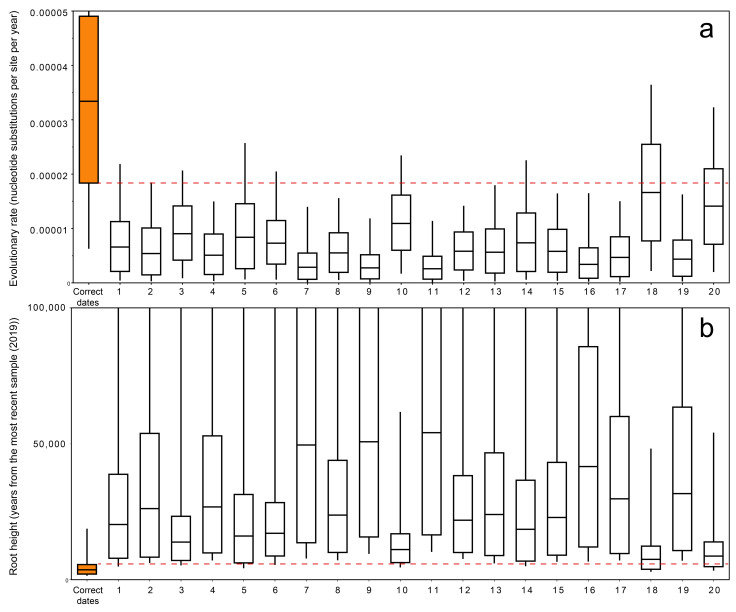
Figure 3.
Date permutation test results: The boxplots present 95% HPD of (a) evolutionary rate and (b) tree root height parameters. Analysis with correct isolation dates is shown as the orange bar. Horizontal dashed lines demonstrate overlapping areas of the analysis using correct dates and permuted replicates.

