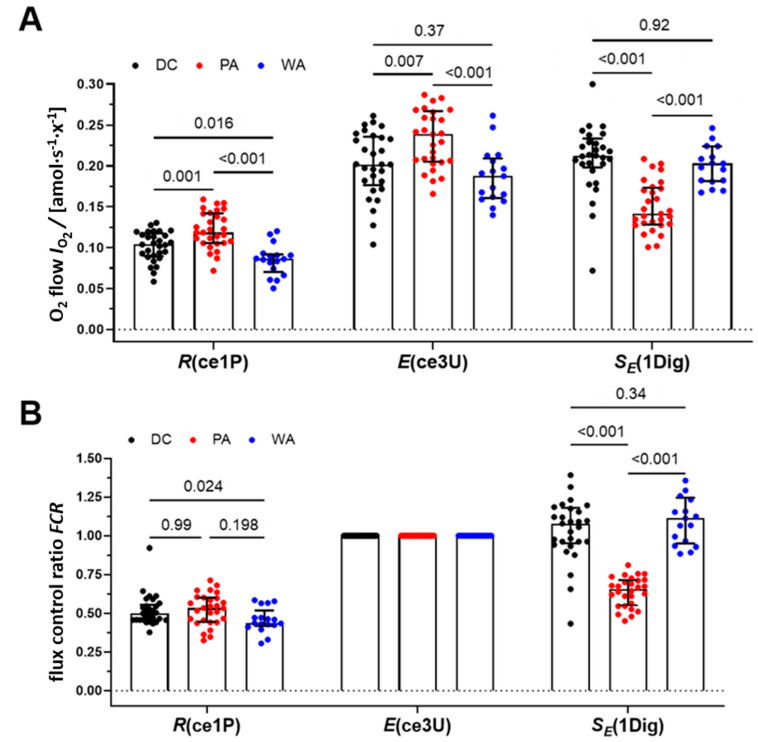
Figure 3.
Effect of isolation methods on PLT respiration. PLT isolated by DC (black dots), PA (red dots), and WA (blue dots). (A) Oxygen flow per cell, IO2 [amol·s−1·x−1], in the ROUTINE- and ET-state of living cells (Rce1P and Ece3U) and S-linked ET capacity of permeabilized cells (SE,1Dig). (B) Flux control ratio (FCR). Ece3U was selected as the reference state. Two-way ANOVA, p values are shown above their respective pairwise comparison bar.

