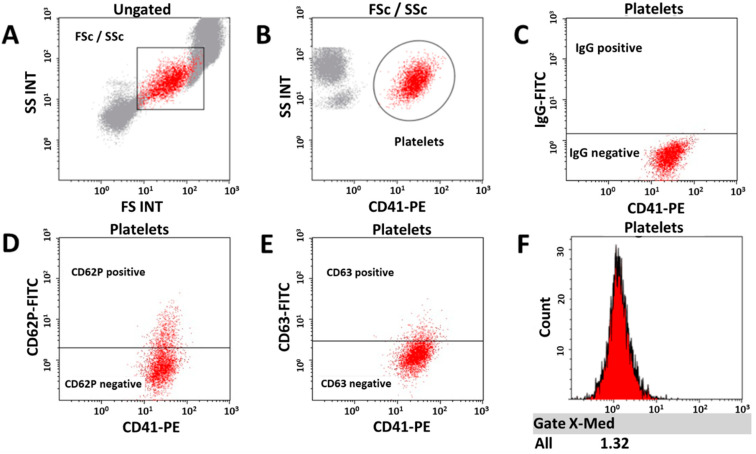
Figure 6.
Expression of PLT activation markers. (A) Preliminary PLT gating based on morphological properties—forward scatter (FS) and side scatter (SS). (B) Precise PLT gating based on CD41 expression. (C) Positive threshold setting based on isotype control (IgG) expression. (D) Evaluation of CD62P activation marker expression. (E) Evaluation of CD63 activation marker expression. (F) Histogram to determine the median MFI of the marker of interest. This is the representative protocol for EDTA control blood samples.

