Figure 9.
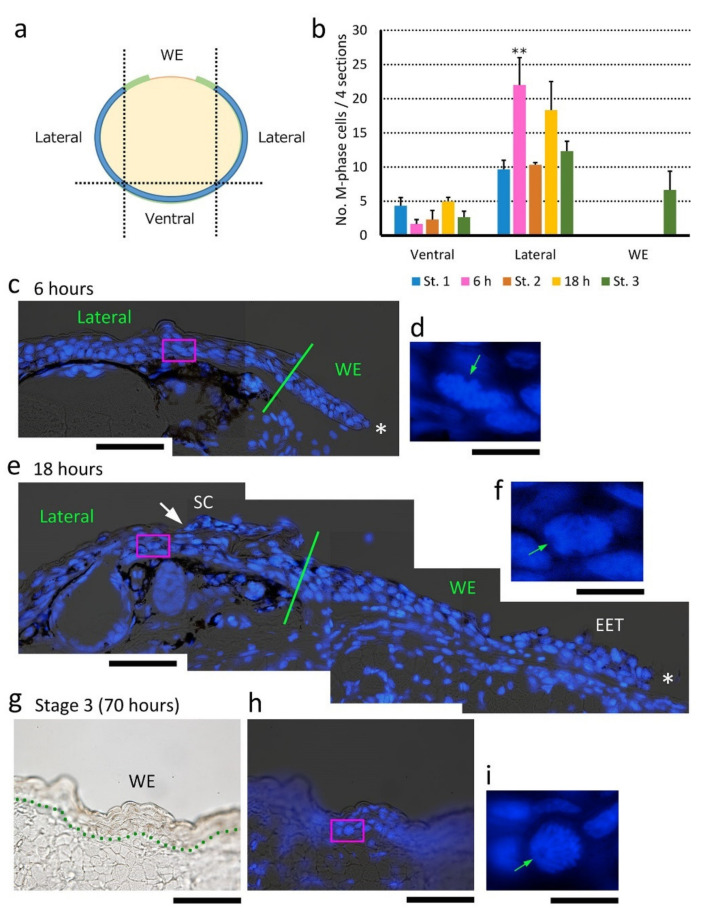
Cell sources for extension of the wound epidermis. (a) A schematic drawing of a transverse section of a forearm, illustrating the terms of the regions in the skin (WE, Lateral and Ventral). In WE, the wound epidermis/extending epidermal tongue (EET) from both sides (light green) was examined. (b) Changes in the number of M-phase cells in defined regions during re-epithelialization. Forearms at Stage 1 (immediately after operation), 6 h, Stage 2 (12 h), 18 h, and Stage 3 (48–70 h) were examined. For Lateral, the number of cells on both sides of the forearm were summed. Data were collected from four sections per forearm, and the data obtained from three forearms (three newts) were compared between stages (see Methods). In Lateral, the number of M-phase cells, or dividing basal stem cells, significantly increased at 6 h (Shirley-Williams’ multiple comparison test, **: p < 0.025), and then returned to a normal level as re-epithelialization proceeded. The wound epidermis started cell division as soon as re-epithelialization was completed (Stage 3). (c–f) Sample images showing mitotic figures in Lateral at 6 and 18 h. The boxes in (c,e) were enlarged in (d,f), respectively. Green lines: position of the wound margin. Asterisks: leading end of the wound epidermis and the EET. The stratum corneum (SC) in (e) was folded (the white arrow points to its distal end). Green arrowheads: spindle pole. The cells in (d,f) were dividing vertically and horizontally, respectively. In (d), two sets of daughter chromosomes had slid horizontally, probably because this cell got caught in collective cell migration. It must be noted that observation of dividing cells in this region was occasional. (g–i) Sample transmitted and DAPI images showing a mitotic figure in the closed wound epidermis (Stage 3). Seventy hours after operation. The dotted line in (g) indicates the border between the wound epidermis and the wound bed. The box in (h) was enlarged in (i). Scale bars: 100 μm (c,e,g,h); 20 μm (d,f,i).

