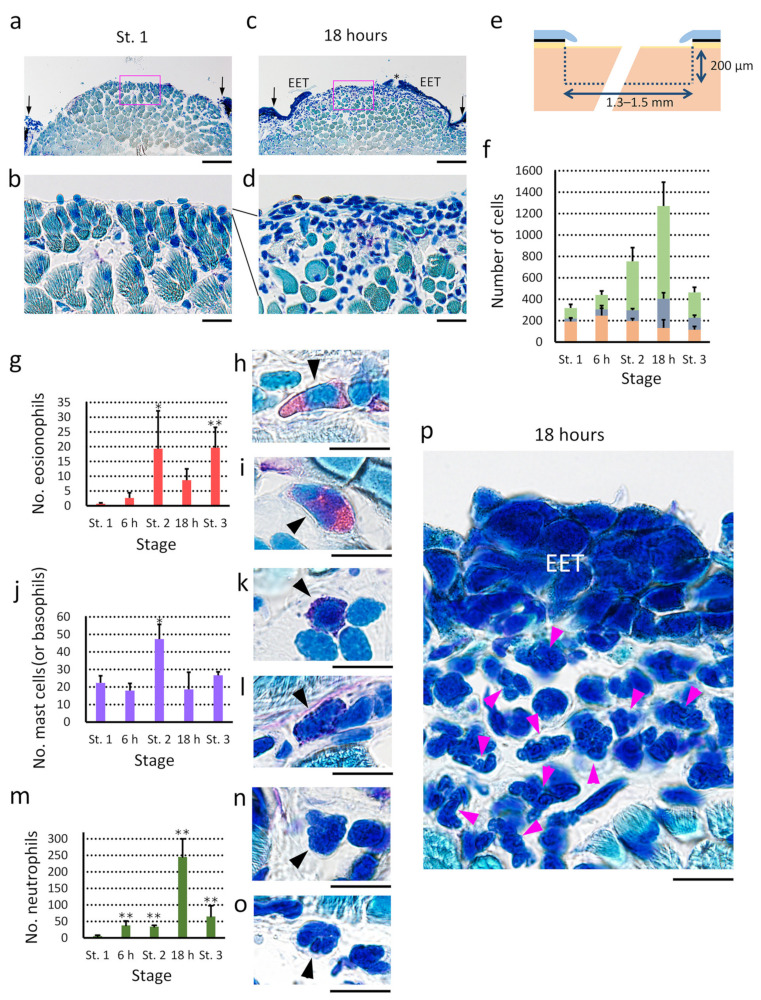
Figure 13.
Inflammatory reaction in the wound bed. Representative images were obtained from transverse sections of the forearms at Stage 1 (immediately after operation), 6 h, Stage 2 (12 h), 18 h, and Stage 3 (48–70 h). Wright-Giemsa stain. (a–d) Mesenchymal cells in the wound bed at Stage 1 and 18 h. The boxes in (a,c) were enlarged in (b,d), respectively. EET: extending epidermal tongue. Arrows in (a,c): position of the wound margin. Dotted lines between (b,d) show the increase of the space between the wound surface (epimysium) and muscle layer at 18 h, in which mesenchymal cells obviously gathered. (e) A schematic drawing of a section, illustrating the region in which the number of mesenchymal cells was counted. (f) Changes in the number of mesenchymal cells in the defined region during re-epithelialization. Data were collected from four sections per forearm, and the data obtained from three forearms (three newts) were compared between stages (see Methods). EM(B)N: eosinophils, mast cells (or basophils) and neutrophils; RBC: mature erythrocytes. (g) Changes in the number of eosinophils. (h,i) Sample images of eosinophils. The cells characteristically had cytoplasm stained pink or orange, and sometimes had a lobated nucleus. (j) Changes in the number of mast cells (basophils). (k,l) Sample images of mast cells (basophils). The cells characteristically had granules stained in dark purple in their cytoplasm. Note that in this study mast cells and basophils could not be differentiated. (m) Changes in the number of neutrophils. (n,o) Sample images of neutrophils. The cells characteristically had a multi-lobed nucleus. (p) Sample image of neutrophils (arrowheads) gathering in the wound bed at 18 h after operation. In this study, statistical significance of the increase against the value at Stage 1 was analyzed by Shirley-Williams’ multiple comparison test (**: p < 0.025; *: p < 0.05). Scale bars: 200 μm (a,c); 40 μm (b,d); 20 μm (h,i,k,l,n–p).

