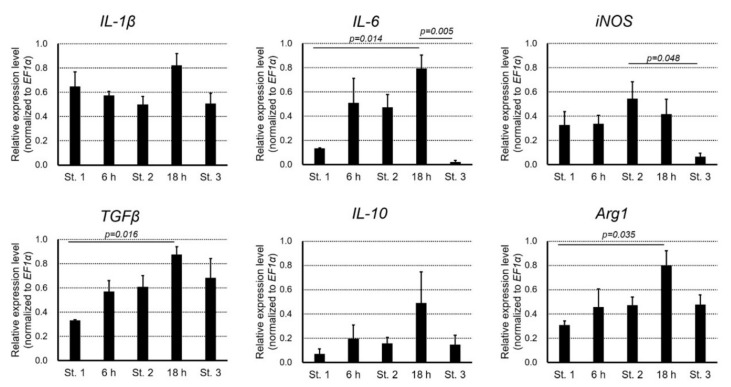
Figure 14.
Changes in the relative expression levels of cytokines during re-epithelialization. Semi-quantitative PCR analysis was carried out with samples of the wound at Stage 1 (immediately after operation), 6 h, Stage 2 (12 h), 18 h, Stage 3 (96 h). The samples contained tissues in a range between the surface (containing the wound epidermis, if present) and a few millimeters depth within the wound area. IL-1β: interleukin-1 beta; IL-6: interleukin 6; iNOS: inducible nitric oxide synthase; TGFβ: transforming growth factor beta; IL-10: interleukin 10; Arg1: arginase 1; EF1α: elongation factor 1 alpha. The statistical significance among stages (n = 3 each) was analyzed by Tukey’s HSD multiple comparison test, and p-values less than 0.05 are illustrated. Sample images of electrophoresis of PCR products are shown in Supplementary Figure S2.

