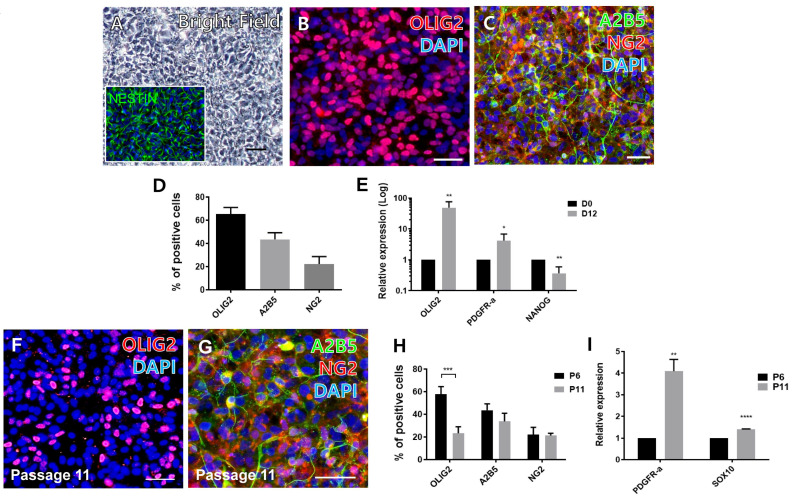
Figure 2.
Induction and expansion of hPSC-derived OPCs. (A) A bright-field image of OPCs at day 12 of differentiation. Scale bar: 20 µm. (Inset) A representative image of NESTIN-positive cells in the culture on day 12. (B,C) Immunofluorescent images of OLIG2, A2B5 and NG2. (D) Quantification of cells positive for OLIG2, A2B5, and NG2. (E) Quantitative gene expression of OPC markers (OLIG2 and PDGFRα) and a pluripotency marker (NANOG). (F,G) Representative images of OLIG2, A2B5- and NG2-positive cells after multiple passages (at passage 11) accompanied with a freeze-thawing cycle. Scale bar: 20 µm. (H) Quantification of marker-positive cells at passage 11. (I) Quantitative gene expression of OPC markers (PDGFRα and SOX10). Scale bars: 10 µm. * p < 0.05, ** p < 0.01, *** p < 0.001, **** p < 0.0001, Student t-test.

