Figure 3.
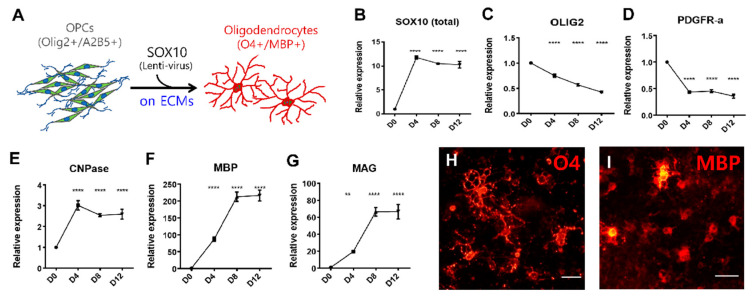
Differentiation of oligodendrocytes from hPSC-derived OPCs via SOX10 overexpression. (A) A schematic diagram for oligodendrocyte differentiation from hPSC-derived OPCs. (B–D) Time-course expression of OPC markers during differentiation. As differentiation proceeded, the transcript levels of OLIG2 and PDGFR-α gradually decreased (C,D) whereas that of SOX10 was maintained due to continued exogenous expression (B). (E–G) Time-course expression of OD markers during differentiation. Expression levels of all marker genes tested were upregulated by SOX10-induced differentiation and plateaued after day 8. (H,I) Representative image of O4- and MBP-positive cells induced by the overexpression of SOX10. Scale bars: 12.5 µm. ** p < 0.01, **** p < 0.0001, one-way ANOVA with Dunnett’s post hoc test.

