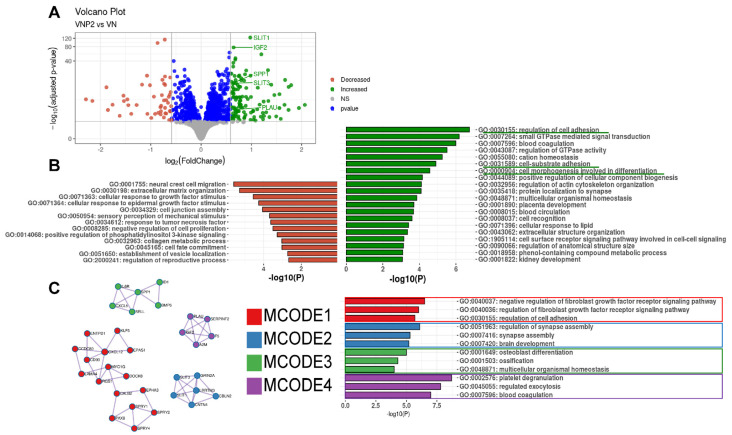
Figure 7.
Analysis of genes that are differentially expressed between OPCs grown on VN and VNP2. (A) A volcano plot of genes obtained from OPCs grown on either VN or VNP2. Dots in green color denote upregulated genes in VNP2, and dots in red color denote downregulated genes in VNP2 compared with VN. (B) GO terms enriched within downregulated genes (red) and upregulated genes (green). (C) Since no significant clusters were identified in the downregulated genes, only the clusters identified in the upregulated genes are shown.

