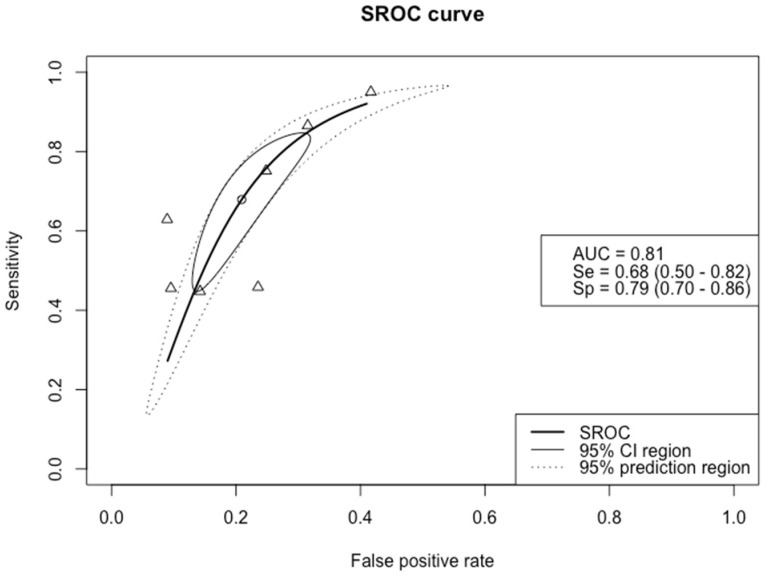
Figure 2.
Summary receiver operating characteristic (SROC) curve of the diagnostic accuracy of Pro–C3 in detecting significant fibrosis. The solid ellipse depicts the 95% confidence interval region of diagnostic accuracy data of Pro–C3 in the included studies; the dotted ellipse depicts the prediction region in which 95% of future diagnostic accuracy study estimates of Pro–C3 will fall. Triangles represent diagnostic accuracy estimates from each included study; circle represents the Youden Index threshold value. AUC = area under the receiver operating curve, Se = sensitivity, Sp = specificity.

