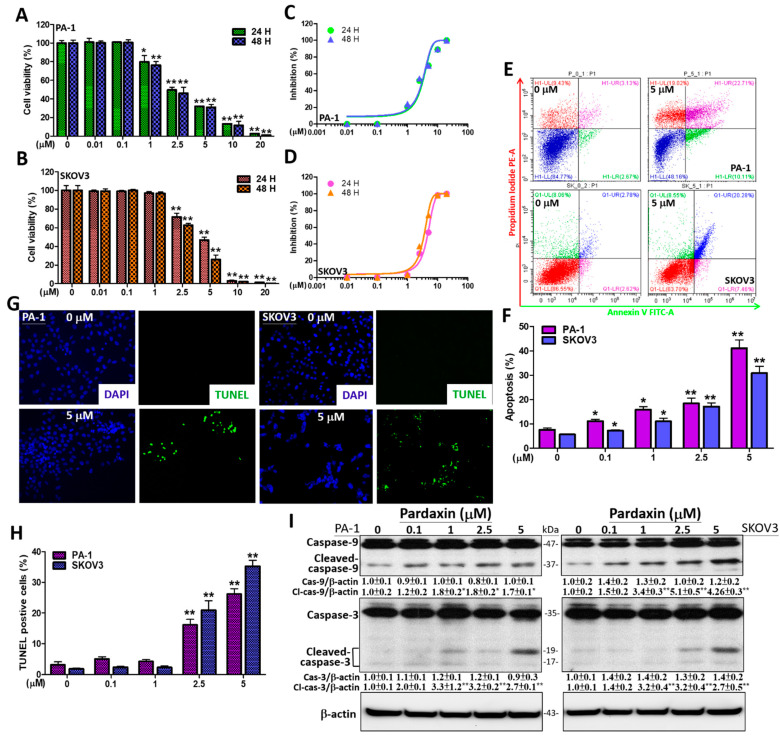
Figure 1.
The effects of pardaxin on viability and DNA fragmentation in PA-1 and SKOV3 cells. (A) PA-1 cells were challenged with pardaxin at concentrations of 0–20 μM for 24 and 48 h prior to the MTT assay. The results are shown as the percentage of viable cells in comparison with pardaxin-untreated cells (0 μM); (B) SKOV3 cells were treated with pardaxin at 0–20 μM for 24 and 48 h and evaluated by the MTT assay. The results are demonstrated as the percentage of viable cells in comparison with pardaxin-untreated cells (0 μM); (C) IC50 values of PA-1 cells were, respectively, determined to be ~3.1 and ~3.0 μM after 24 and 48 h of pardaxin exposure; (D) IC50 values of SKOV3 cells were respectively determined to be ~4.6 and ~3.5 μM after 24 and 48 h of pardaxin incubation; (E) Flow cytometry with staining of Annexin V and PI was performed to evaluate pardaxin-induced apoptosis. The left charts represent the results for untreated cells, whereas the right charts show the results at 5 μM pardaxin. In the chart, the upper right quadrant (Annexin Vpositive/PIpositive) indicates the number of apoptotic cells and the lower right quadrant indicates the number of early apoptotic cells. (F) Quantitation of Annexin Vpositive/PIpositive and Annexin Vpositive/PInegative regions at concentrations of 0–5 μM of pardaxin. (G) The TUNEL assay shows apoptotic bodies (green immunofluorescence) after treatment with 0 and 5 μM of pardaxin for 24 h. DAPI staining (blue) was completed to observe cell DNA/nuclei using a laser confocal microscope at a magnification of 200×. (H) Quantification of TUNEL positive cells. (I) The PA-1 and SKOV3 cells were challenged with 0–5 μM of pardaxin for 24 h. Protein bands from the Western blot showing the bands for caspases-3/9, cleaved forms of caspases-3/9 as well as the internal control β-actin. Full, uncropped Western blot images and bar charts of the quantified protein values are presented in Supplementary Figure S1. Each bar represents the result of mean ± SE determined from three independent trials. Student’s t-test was used for analysis in which * p < 0.05 and ** p < 0.01 show statistical significance compared with the control.

