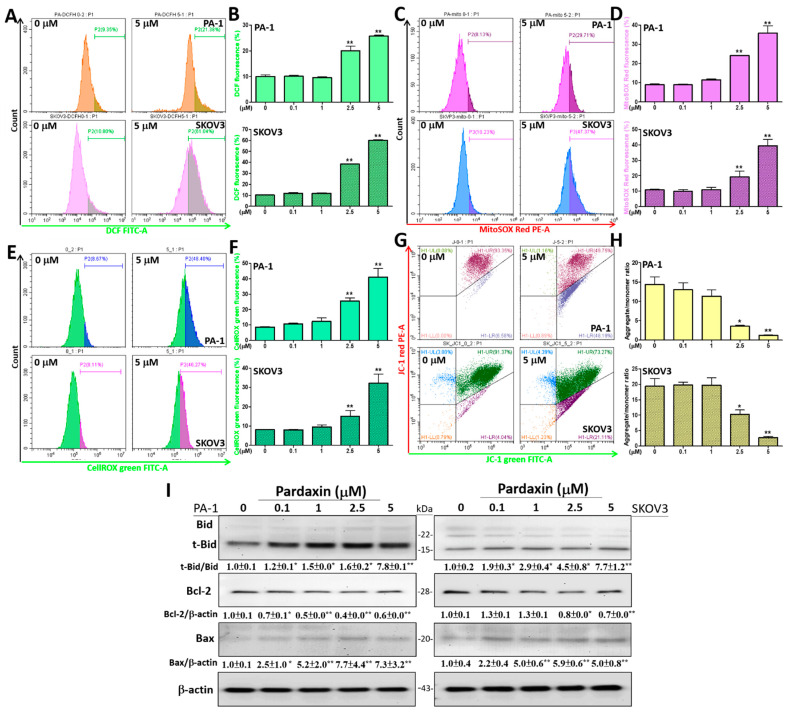
Figure 2.
Pardaxin induces mitochondrial and intracellular ROS production, the disruption of mitochondrial membrane potential, and expression of apoptosis-related proteins in PA-1 and SKOV3 cells. (A) The measured fluorescence intensity of DCF for intracellular ROS at 0 or 5 µM pardaxin for 24 h; (B) quantitation of DCF accumulation by analyzing the selected range (5 × 10³–106) of univariate histograms; (C) the measured fluorescence intensity of MitoSOXTM Red for detecting mitochondrial O2•− at 0 or 5 µM pardaxin for 24 h; (D) quantification of O2•− amount in mitochondria by analyzing the selected range (5 × 10²–105) of univariate histograms; (E) the measured fluorescence intensity of CellROX® Green for detecting mitochondrial and nuclear O2•− and •OH at 0 or 5 µM pardaxin for 24 h; (F) quantification of O2•− and •OH in cancer cells by analyzing the selected range (5 × 10⁴–106) of univariate histograms; (G) cancer cells were treated with or without 5 μM of pardaxin for 24 h. Changes in ΔΨ were measured using flow cytometry and JC-1 dye with a decrease in red fluorescence indicating mitochondrial depolarization; (H) quantitation of JC-1 signals by analyzing the selected range of the quadrant plot. Values from high/low ΔΨ (upper right/lower right) quadrants were used for determining the aggregated/monomer JC-1 ratios; (I) Western blot analyses with antibodies against apoptosis-related proteins Bid, t-Bid, Bcl-2, and Bax, and the internal control β-actin. The ImageJ software was used for densitometric analysis of intensity of each band. The densitometric values are displayed underneath the protein bands after being normalized to β-actin levels. Full, uncropped Western blot images and bar charts of the quantified protein values are shown in Supplementary Figure S2. Each bar represents the result of mean ± SE determined from three independent trials. Student’s t-test was performed to determine the significance where * p < 0.05 and ** p < 0.01 show statistical significance compared with the control (pardaxin-untreated cells).

