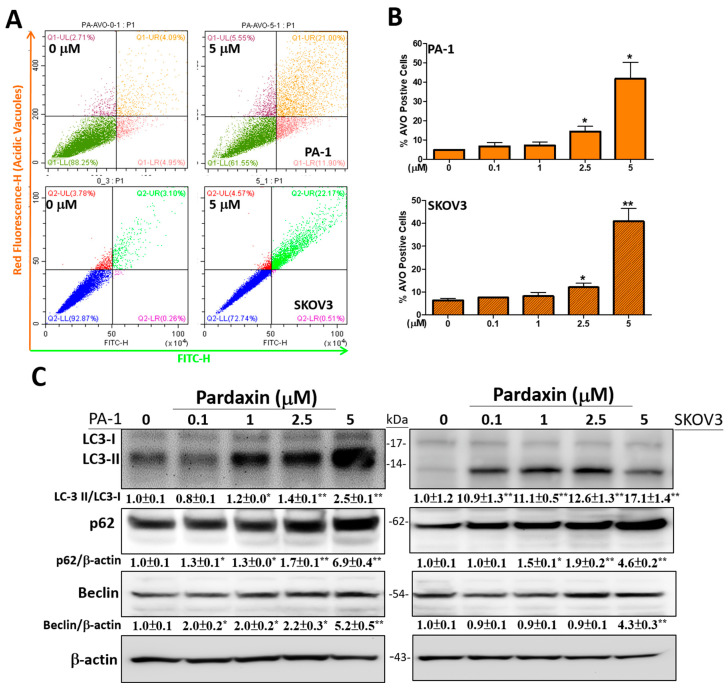
Figure 3.
Pardaxin induces late-stage autophagy and the expression of autophagy-related proteins in PA-1 and SKOV3 cells. (A) The measured fluorescence intensity of AO for detecting late-stage autophagy at 0 or 5 µM pardaxin for 24 h; (B) Quantitation of AVO positive cells after treatment with 0–5 µM of pardaxin for 24 h were analyzed using Beckman CytoExpert flow software; (C) Western blot analyses with antibodies against the apoptosis-related proteins, LC3-I, LC3-II, p62, Beclin, and the internal control β-actin. The ImageJ software was used for densitometric analysis of intensity of each band. The densitometric values are displayed underneath protein bands after being normalized to β-actin levels. Full, uncropped Western blot gels and bar charts of the quantified protein values are presented in Supplementary Figure S3. Each bar represents the result of mean ± SE determined from three independent trials. Student’s t-test was performed to determine the significance where * p < 0.05 and ** p < 0.01 show statistical significance compared with the control (pardaxin-untreated cells).

