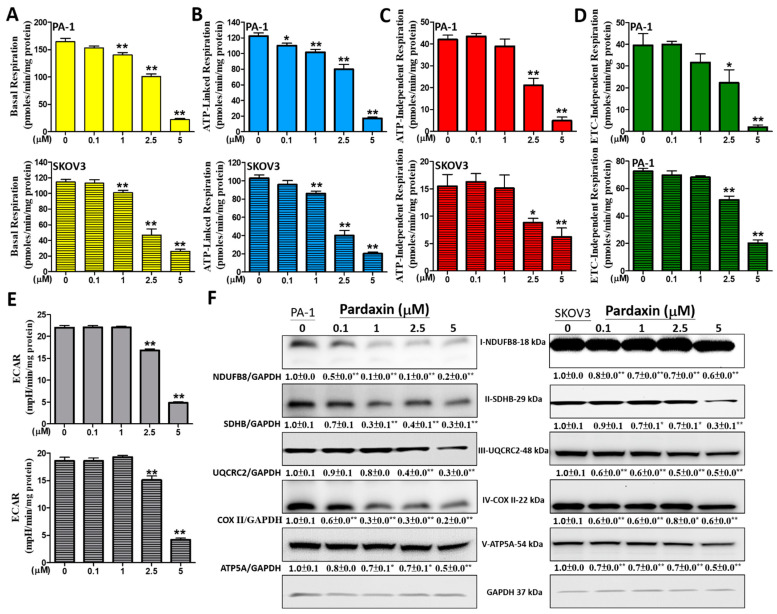
Figure 4.
The effects of pardaxin on OCR parameters, ECARs, and five OXPHOS enzymatic complexes in PA-1 and SKOV3 cells. Both OCRs (pmoles/min/mg protein) and ECARs (mpH/min/mg protein) were measured before and after the pharmacological inhibitor solutions were added to living cells. To provide a reliable base value, four measurements were taken and averaged; subsequently, cells were sequentially and continuously injected assay reagents of the pharmacological inhibitors oligomycin, FCCP, and antimycin/rotenone. (A) Quantification of basal respiration OCRs; (B) quantification of ATP-linked respiration; (C) quantification of maximal respiration capacity OCRs; (D) quantification of proton leak respiration OCRs; (E) quantification of ECARs. The upper data are for PA-1 cells, whereas the lower data are for SKOV3 cells; (F) protein bands from the Western blot showing the effects of sinularin on the expression levels of complexes I-NDUFB8, II-SDHB, III-UQCRC2, IV-COX II, and V-ATP5A with GADPH as the blot control. Full, uncropped Western blot images and bar charts of the quantified protein values are displayed in Supplementary Figure S4. The ImageJ software was used for densitometric analysis of the protein expression levels of the abovementioned complexes and the densitometric values are displayed underneath the protein bands after being normalized with the GADPH level. Each bar represents the result of mean ± SE determined from three independent trials. Student’s t-test was used to determine the significance where * p < 0.05 and ** p < 0.01 show statistical significance compared with the control (pardaxin-untreated cells).

