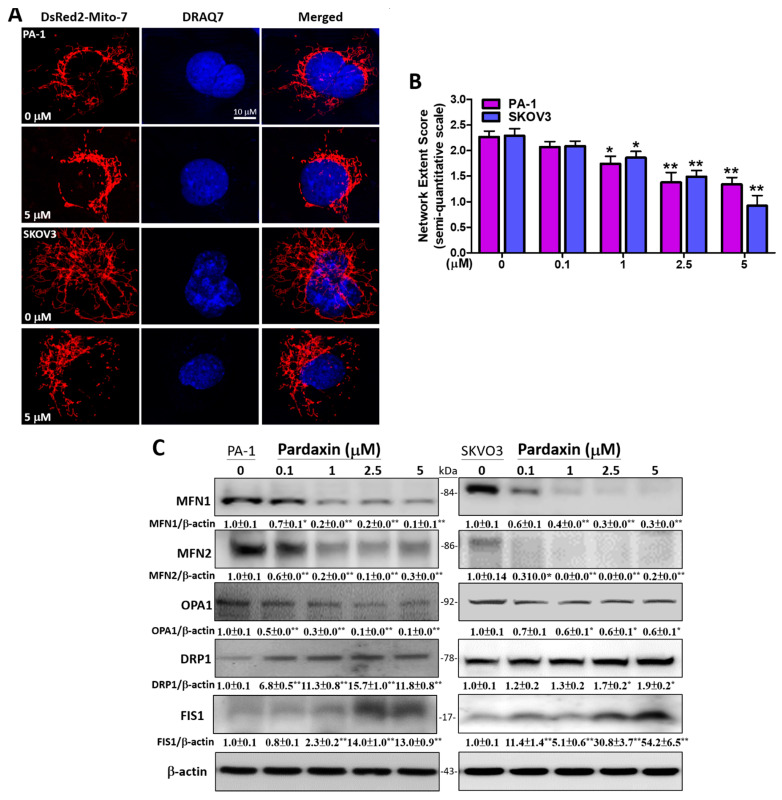
Figure 5.
The effects of pardaxin on mitochondrial morphology and the expression of fission and fusion-related proteins in PA-1 and SKOV3 cells after being treated with 0 or 5 µM of pardaxin. (A) The fluorescent mitochondrial network and nuclei following the transfection of DsRed2-Mito-7 (red florescence) plasmid and DRAQ7 staining, respectively, at a magnification of 2000×; (B) the semi-quantitative scale values of mitochondrial network were averaged from 20–30 cells in high-power fields at a magnification of 2000×; (C) protein bands from the Western blot presenting the expression of MFN1/2, L-/S-OPA1, DRP1, FIS1, and the internal control β-actin. Full, uncropped Western blot images and bar charts of the quantified protein values are presented in Supplementary Figure S5. The ImageJ software was used for densitometric analysis of the protein expression levels, and the densitometric values are displayed underneath the protein bands after normalizing to corresponding β-actin levels. Each bar represents the result of mean ± SE determined from three independent trials. Student’s t-test was used for analysis where * p < 0.05 and ** p < 0.01 show statistical significance compared with the control.

