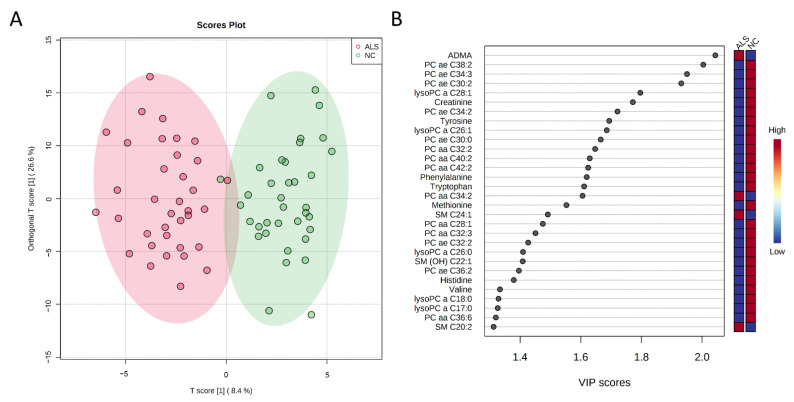
Figure 1.
Orthogonal partial least squares-discriminant analysis (OPLS-DA) between normal controls (NCs, n = 36) and patients with amyotrophic lateral sclerosis (ALS) (n = 36). (A) OPLS-DA shows a separation of metabolites between two groups (R2Y = 0.389, Q2 = 0.311). R2Y, cumulative variation in the Y matrix; Q2, predictive performance of the model. (B) The top 30 metabolites with variable importance in the projection (VIP) score > 1.0 indicating their contribution to the classification in the OPLS-DA model. aa: acyl-acyl; ae: acyl-alkyl; ADMA: asymmetric dimethylarginine; OH: hydroxy; lysoPC: lysophosphatidylcholine; PC: phosphatidylcholine; SM: sphingomyelin.

