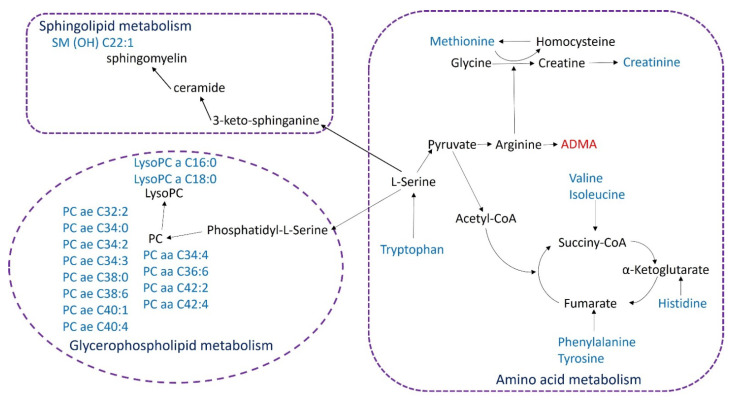
Figure 4.
Network of the identified key biomarkers and pathways in plasma of patients with amyotrophic lateral sclerosis. The metabolites colored blue or red represent declining or increasing levels, respectively. Aa: acyl-acyl; ae: acyl-alkyl; ADMA: asymmetric dimethylarginine; OH: hydroxy; lysoPC: lysophosphatidylcholine; PC: phosphatidylcholine; SM: sphingomyelin.

