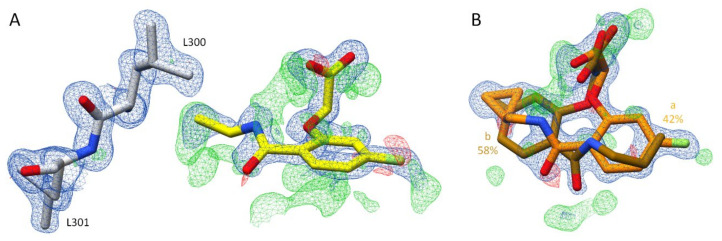
Figure 9.
(A): Crystal structure of ALR-2 • 5 (not deposited) and the electron density around the ligand. Inhibitor 5 is shown in yellow; gatekeeper residues L300 and L301 are indicated in grey. Oxygen atoms are displayed in red, nitrogen atoms in blue, sulfur atoms in yellow, and fluorine atoms in green. (B): Crystal structure of ALR-2 • 6 (6SYW) and the corresponding electron density. Inhibitor 6 is shown in orange. To distinguish the conformations of 6, b is highlighted by a slightly darker color. The respective occupancy is indicated in each case. The difference electron density map (FO − FC) is depicted in both cases as red and green meshes at a contour level of 3σ. The 2FO − FC density is depicted as blue mesh at the 1σ level.

