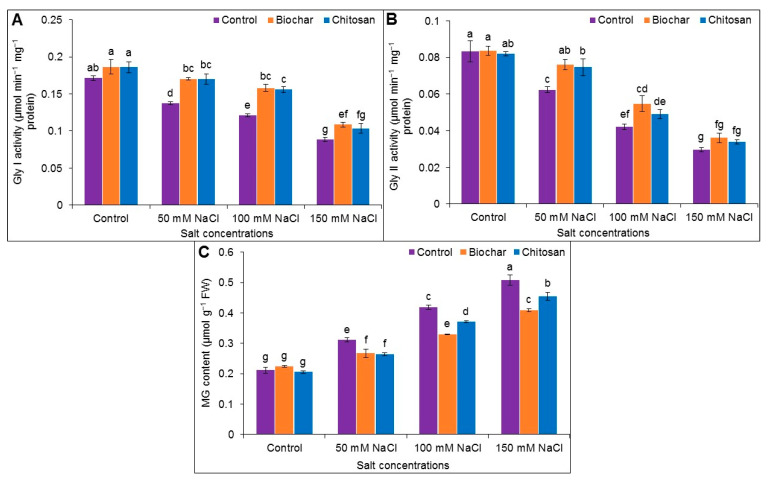
Figure 8.
Activities of Gly I (A), Gly II (B), and MG content (C) of jute as affected by biochar and chitosan under different concentrations of NaCl. Mean value (±SD) was calculated from three replications, and different letters on the columns indicate significant differences among the treatments at p ≤ 0.05 applying Fisher’s LSD test.

