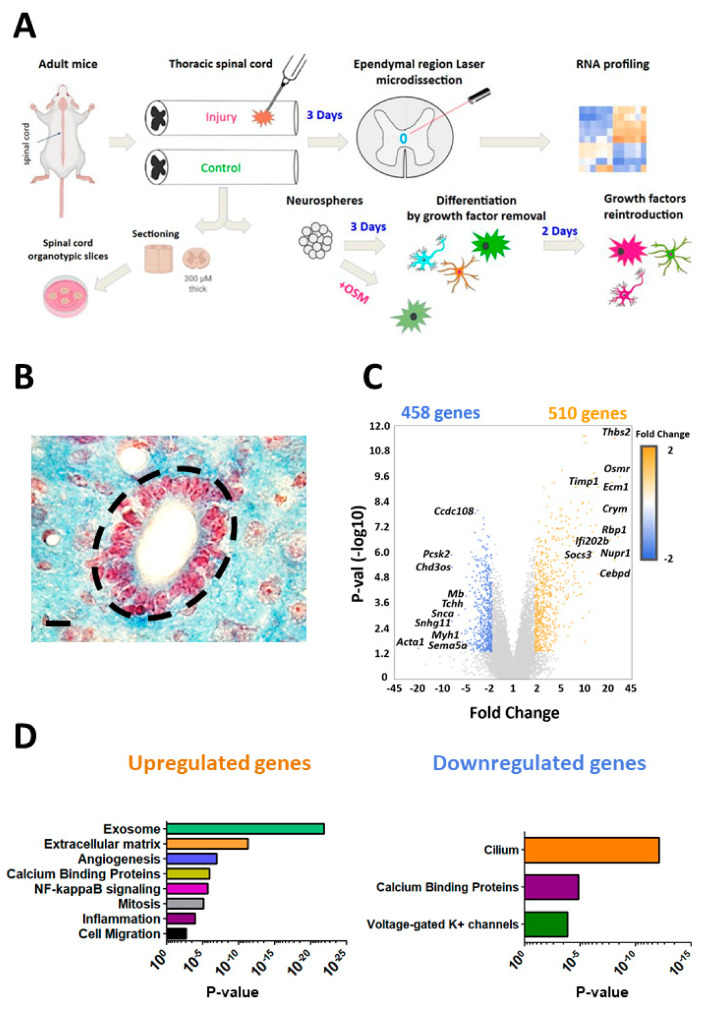
Figure 1.
Bioinformatics analysis of ependymal gene expression in SCI. (A): Schematic overview of main article steps and techniques. (B): Mouse spinal cord ependymal region. Ependymal cell nuclei (thoraco-lumbar level) are stained in red with neutral red dye. Surrounding parenchyma is stained in blue with luxol fast blue. The microdissected area is delimited with black dashed lines. (C): Volcano plots of genes whose expression are dysregulated after injury in the ependymal region (fold change ≥2 or −2). Top10 up and downregulated genes are indicated. (D): Selection of Gene Ontology analysis for up- and down-regulated genes with p-values. Comprehensive gene ontology analysis is provided on Table S1.

