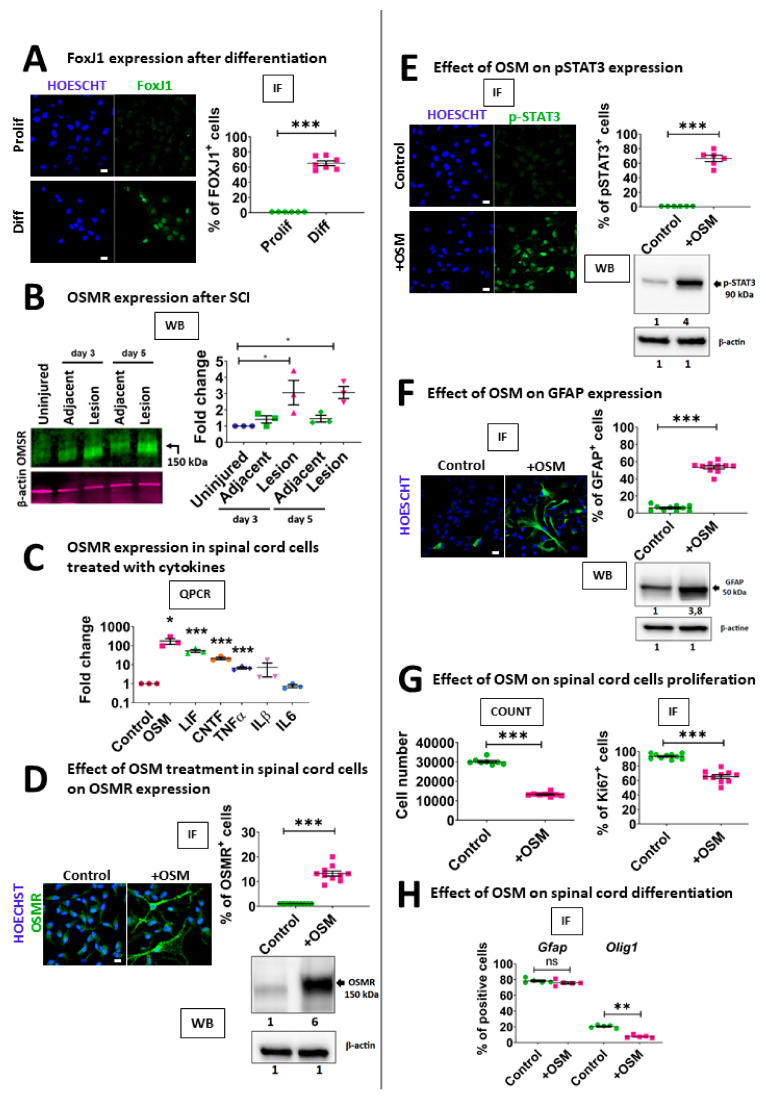
Figure 5.
OSM affects OSMR expression, neurosphere growth and differentiation. (A): Left-hand images: immunofluorescences for FOXJ1 in spinal cord neurosphere cells cultured in proliferation (with growth factors) or differentiation (without growth factors) conditions. Scale bar = 10 µm. Right panels: immunofluorescence quantification (n = 7 fields). (B): Left-hand panel: WB for OSMR on proteins extracted from control and injured total spinal cord (3 and 5 days post injury). Proteins were extracted from spinal cord segments containing and adjacent to the lesion site. β-actin was used for normalization. Right-hand panel: WB quantification. Values represent fold change compared to uninjured spinal cord protein extracts. Tests = one way ANOVA with Tukey post-hoc tests. n = 3 independent experiments. (C): QPCR for Osmr RNA in growing spinal cord neurospheres treated for 3 days with indicated cytokines. Values represent fold change compared to untreated neurospheres. Statistical tests were performed with Bootstratio [23] compared to non-treated neurospheres. n = 3 independent experiments. (D): Left-hand panels: immunofluorescences for OSMR in control or OSM-treated spinal cord neurosphere cells. Scale-bar = 10 µm. Right-hand panel: immunofluorescence quantification (n = 10 fields). Test = two tailed t-test. Lower panel. WB for OSMR on proteins extracted from untreated and OSM-treated neurospheres. Numbers represent quantification (fold change) compared to untreated neurospheres. β-actin was used for normalization. (E): Left-hand panels: immunofluorescences for p-STAT3 (phospho-STAT3) in control or OSM-treated spinal cord neurosphere cells. Scale-bar = 10 µm. Right-hand panel: immunofluorescence quantification (n = 6 fields). Test = two tailed t-test. Lower panel. WB for p-STAT3 on proteins extracted from untreated and OSM-treated neurospheres. Numbers represent quantification (fold change) compared to untreated neurospheres. β-actin is used for normalization. (F): Left panels: Immunofluorescence for GFAP in untreated and OSM-treated neurosphere cell cultures. Right-hand panel: immunofluorescence quantification (n = 10 fields). Test = two tailed t-test. Lower panel: WB for GFAP on proteins extracted from untreated and OSM-treated neurospheres. Numbers represent quantification (fold change) compared to untreated neurospheres. β-actin is used for normalization. (G): Effect of OSM on neurosphere growth. Left-hand panel: Diagram shows the number of cells obtained in untreated and OSM-treated neurospheres 6 days after seeding (n = 8 wells). Test = two tailed t-test. Right-hand panel: Diagram shows the % of MKI67+ cells obtained in untreated and OSM-treated cell cultures (n = 10 fields). Test = two tailed t-test. (H): Effect of OSM on spinal cord stem cell differentiation. Diagram shows the % of GFAP+ and OLIG1+ cells, 4 days after differentiation in untreated and OSM-treated cell cultures. Tests = Mann-Whitney tests, n = 5 independent experiments. ***, p < 0.001; **, p < 0.01; *, p ≤ 0.05. n.s. = not significant. IF = immunofluorescence.

