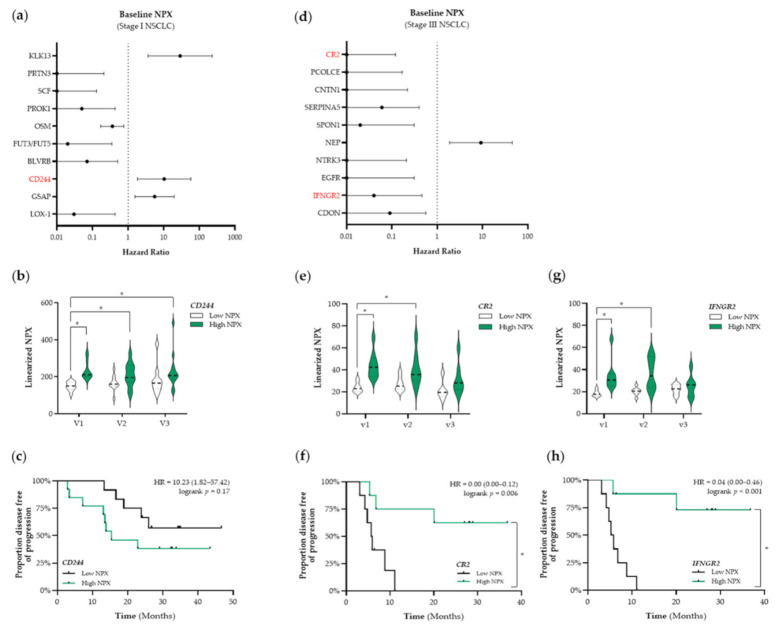
Figure 4.
Identification of prognostic immune-related proteins in patients with NSCLC. (a) The Cox Proportional-Hazards model was used to identify proteins associated with PFS at baseline (v1) in patients with stage I NSCLC (n = 25). The top 10 proteins associated with PFS in patients with stage I are displayed in a forest plot. The closed circles represent the Hazard Ratio of each identified protein and the horizontal lines illustrate the 95% confidence interval. Immune-related proteins are indicated in red. (b,c) Patients with stage I NSCLC (n = 25) were stratified into low (black) or high (green) CD244 (Signaling Lymphocyte Activation Molecule (SLAM) family immunoregulatory receptor) NPX-based “risk groups” by considering the median NPX value of the CD244 protein at v1 as a cut-off. (b) The linearized CD244 NPX values are presented in a violin plot, showing the distribution of the CD244 NPX values at each timepoint. The median is indicated by the dashed line, the quartiles are indicated by the dotted lines. (c) Kaplan–Meier plot of the low CD244 NPX group and high CD244 NPX group on the patients’ PFS. (d) The Cox Proportional-Hazards model was used to identify proteins associated with PFS at baseline (v1) in patients with stage III NSCLC (n = 18). The top 10 proteins associated with PFS in patients with stage III are displayed in a forest plot. Immune-related proteins are indicated in red. (e–h) Patients with stage III NSCLC (n = 18) were stratified into low (black) or high (green) NPX-based “risk groups” by considering the median NPX value of the protein at v1 as a cut-off. (e) The linearized CR2 (complement receptor 2) NPX values are presented in a violin plot, showing the distribution of the CR2 NPX values at each timepoint. (f) Kaplan–Meier plot of the low CR2 NPX group and high CR2 NPX group on the patient’s PFS. (g) The linearized IFNGR2 NPX values are presented in a violin plot, showing the distribution of the IFNGR2 NPX values at each timepoint. (h) Kaplan–Meier plot of the low IFNGR2 NPX group and high IFNGR2 NPX group on the patient’s PFS. In all Kaplan–Meier plots, respective logrank test p-values and Hazard Ratios (HR with its 95% confidence interval in parenthesis) are displayed. To compare differences between groups, the non-parametric Kruskal–Wallis test was applied followed by Dunn’s post-hoc testing with Bonferroni correction. A nominal p-value less than 0.05 was considered to be statistically significant and is indicated through an asterisk (*).

