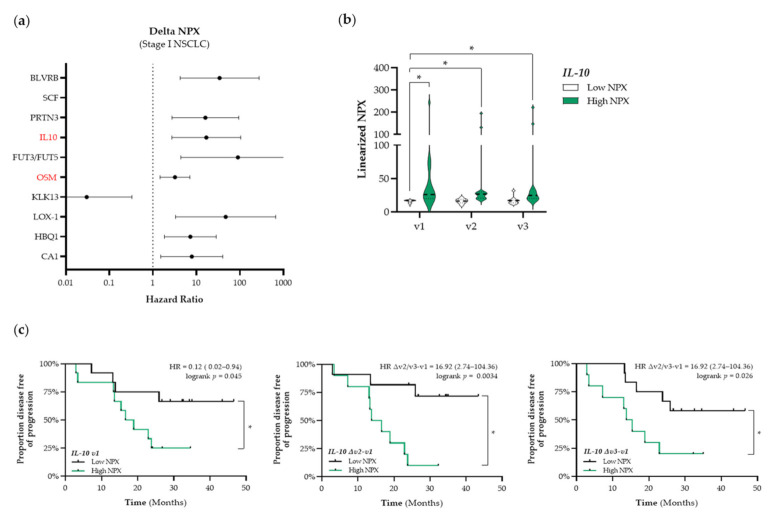
Figure 5.
Identification of predictive immune-related proteins that are altered in response to therapy in patients with stage I NSCLC. (a) The Cox Proportional-Hazards model was used to identify proteins of which the delta NPX value was associated with PFS in patients with stage I NSCLC (n = 25). The top 10 proteins of which the delta NPX value was associated with PFS in patients with stage I are displayed in a forest plot. The closed circles represent the Hazard Ratio of each identified protein and the horizontal lines illustrate the 95% confidence interval. Immune-related proteins are indicated in red. (b,c) Patients with stage I NSCLC (n = 25) were stratified into low (black) or high (green) IL-10 (interleukin-10) NPX-based “risk groups” by considering the median NPX value of the IL-10 protein at v1 as a cut-off. (b) The linearized IL-10 NPX values are presented in a violin plot, showing the distribution of the IL-10 NPX values at each timepoint. The median is indicated by the dashed line, the quartiles are indicated by the dotted lines. (c) Kaplan–Meier plots of the low IL-10 NPX group and high IL-10 NPX group on the patient’s PFS at baseline (v1) (left), after the 2nd fraction of SBRT (Δv2−v1) (middle), and after the final fraction of SBRT (Δv3−v1) (right). A nominal p-value less than 0.05 was considered to be statistically significant and is indicated through an asterisk (*).

