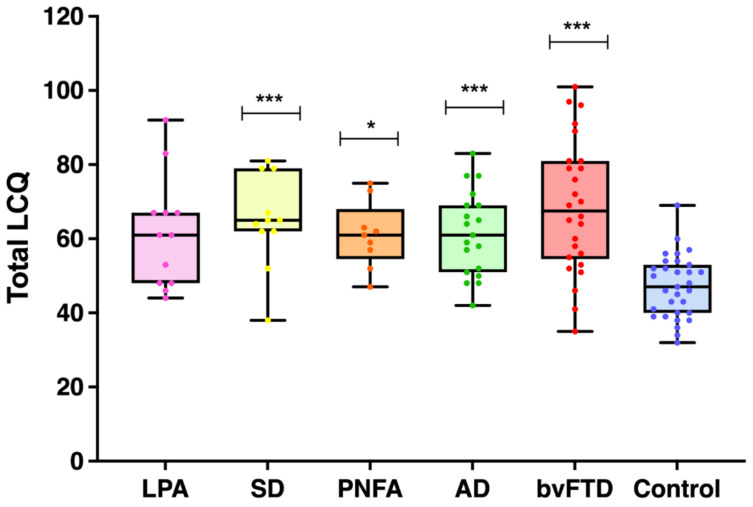
Figure 1.
Distribution of total scores on the La Trobe Communication Questionnaire for all groups. Higher scores indicate greater social communication deficits. Asterisks denote significant group differences in relation to control scores. * p < 0.005, *** p < 0.001. Dots represent individual data points. Error bars represent minimum to maximum values.

