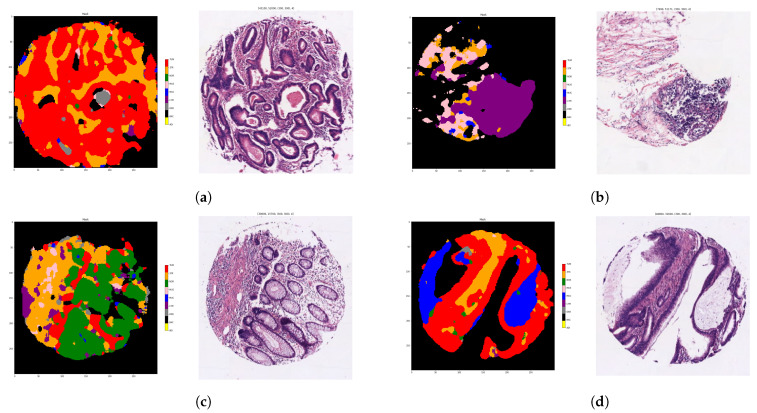
Figure 3.
Examples of spots with each tissue region coded with different colors: tumor epithelium (red), stroma (orange), normal epithelium (green), mucin (blue), muscular fibers (pink), lymphocytic infiltrates (purple), debris (grey), adipose tissue (yellow) and background (black). Each sub-figure (a–d), corresponds to one example of spot where the original sample is placed on the right and the corresponding color mask is placed on the left. The tissue class for each pixel is computed as the majority tissue class of partial overlapping tiles applying a sliding window to raster each spot. Tiles were input to the tissue classifier module at ×20 magnification.

