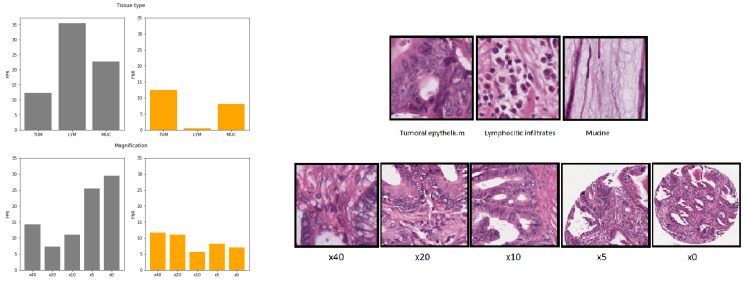
Figure 7.
Average of false positive rates (gray) and false negative rates (orange) at tile level for the 5 fold bias-controlled models by tissue type (figures above): tumor epithelium (TUM), lymphocytic infiltrates (LYM) and mucin (MUC) and different magnifications (figures below): ×40, ×20, ×10, ×5, ×0.

