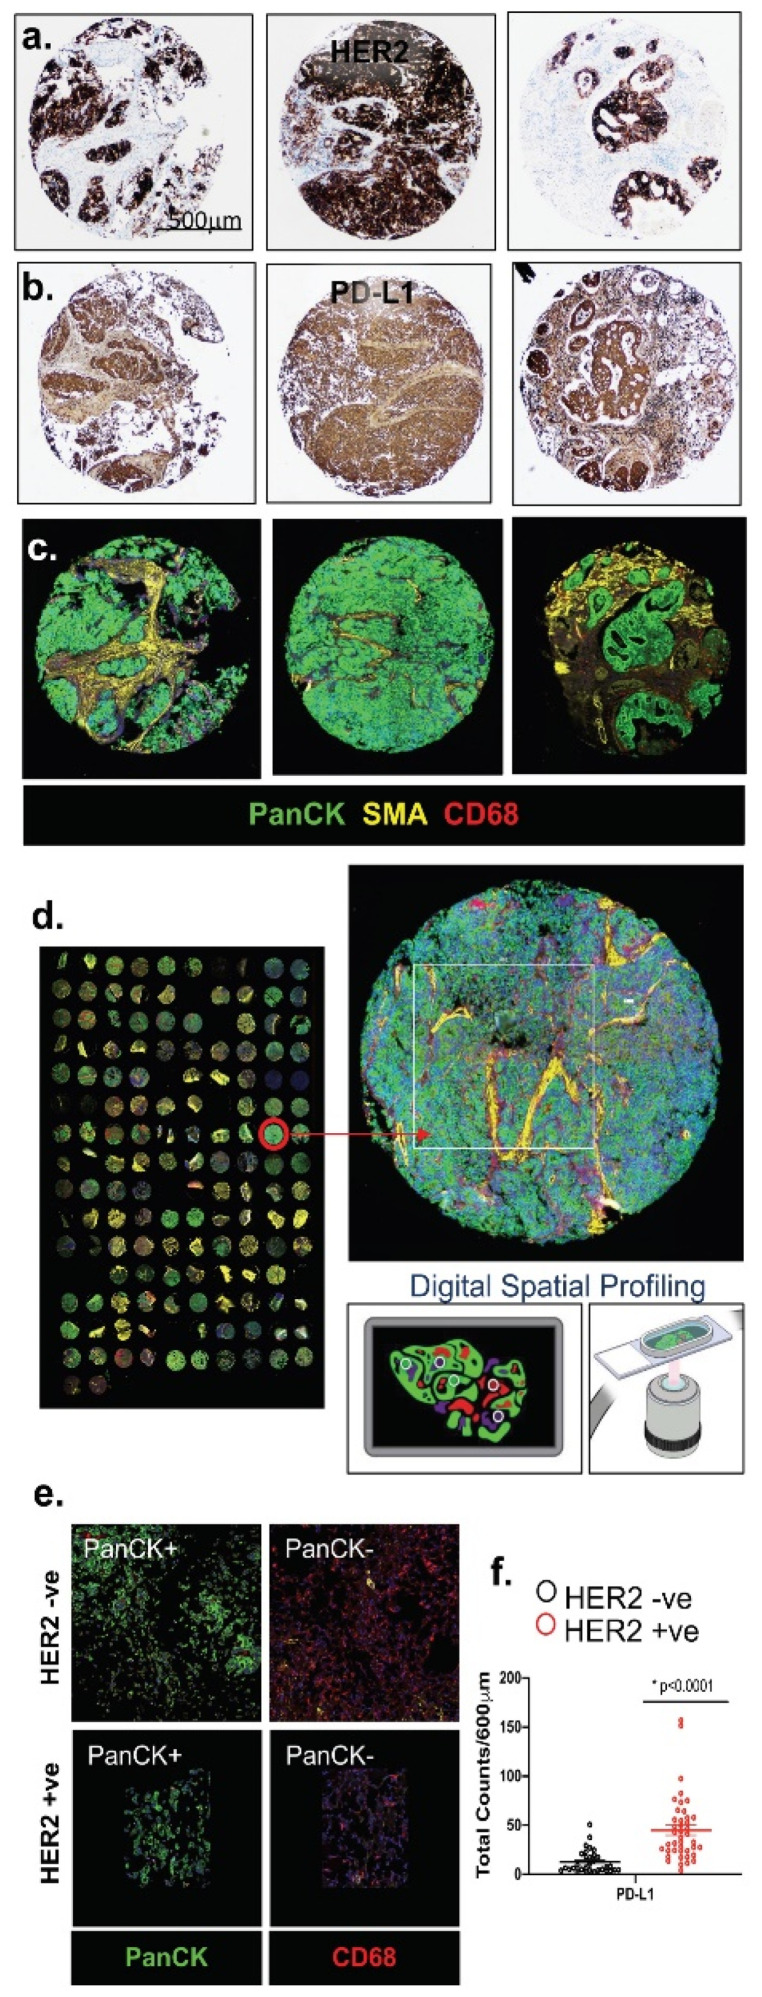
Figure 1.
Immunohistochemistry and DSP analysis of FFPE tissue sections obtained from normal stomach and gastric tumor tissues. Immunohistochemical staining of representative ROIs for (a) HER2 and (b) PD-L1. DSP analysis of representative ROIs selected from (c) gastric cancer tissues showing staining for PanCK, SMA and CD68. DSP analysis of the whole tissue array (d) and a higher magnification of the selected tissue with ROI selection for Digital Spatial profiling and UV crosslinking. Analysis of the (e) tumor marker (PanCK) and immune marker (CD68) among PanCK-positive (+ve) and PanCK-negative (−ve) (CD68 + ve) areas of the FFPE tissues. (f) Quantitative expression of PD-L1 in HER2 −ve and HER2 +ve gastric cancer tissues. * p < 0.0001 compared to HER2 −ve gastric cancer tissue, n = 26 HER2 −ve and n = 46 HER2 +ve) (CD68 + ve) areas of the FFPE tissues. (f) Quantitative expression of PD-L1 in HER2 −ve and HER2 +ve gastric cancer tissues. * p < 0.0001 compared to HER2−ve gastric cancer tissue, n = 26 HER2 −ve and n = 46 HER2 +ve gastric cancer patients. Scale bar = 500 μm.

