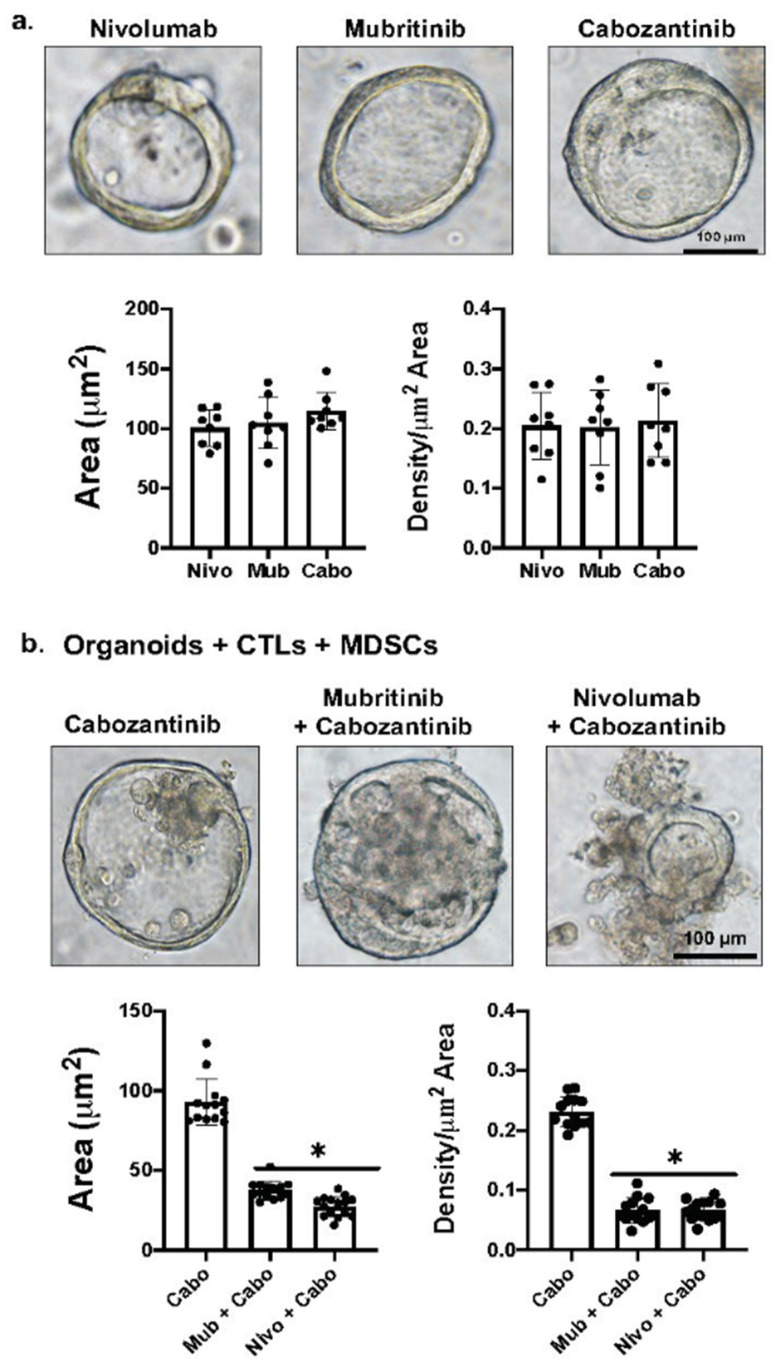
Figure 5.
Effect of drug alone on organoid growth and viability. (a) Brightfield images and quantification of organoid area using cultures treated with Nivolumab, Mubritinib and Cabozantinib alone. (b) Brightfield images and quantification of organoid area using organoid/CTL/MDSC co-cultures treated with Cabozantinib alone, Nivolumab plus Cabozantinib, or Mubritinib plus Cabozantinib. * p < 0.05 compared to Cabozantinib alone. Scale bar = 100 μm.

