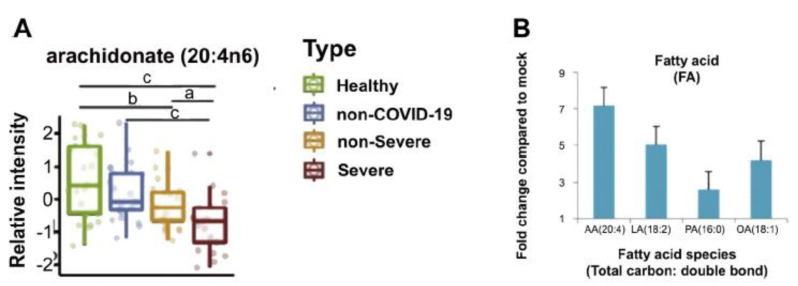
Figure 15.
(A) Plasma levels of AA in those infected with SARS-CoV-2. (B) Fold change compared to mock. These results show that those infected with the virus have low levels of AA. These data are taken from Reference [144]. a, b, c p < 0.05 compared to respective controls, as shown in the figure.

