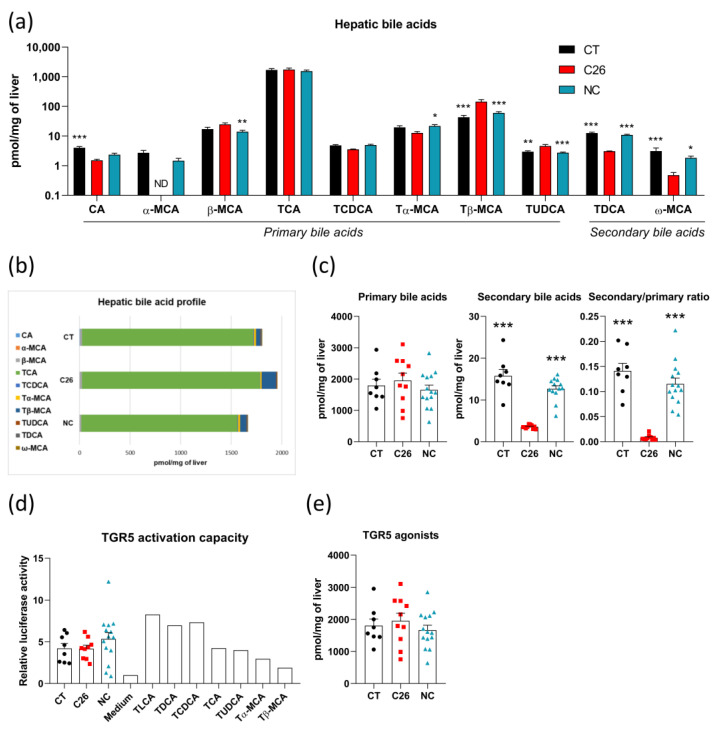
Figure 3.
Alterations in bile acid profile are intrinsically related to cachexia without any modification of TGR5 activation capacity in C26 mice. (a) Hepatic bile acids in sham-injected mice (CT; n = 8), mice injected with cachexia-inducing C26 colon carcinoma cells (C26 mice; n = 10), and mice injected with non-cachexia-inducing C26 colon carcinoma cells (NC mice; n = 14). (b) Hepatic bile acid profile in CT, C26, and NC mice. (c) Primary and secondary bile acid levels and Secondary/primary ratio in the liver of CT, C26, and NC mice. (d) TGR5 activation capacity using cell reporter assay incubated with portal plasma of CT, C26, and NC mice or 10 µM of bile acids. (e) TGR5 agonists (including CA, TCA, TCDCA, TUDCA, and TDCA) levels in the liver of CT, C26, and NC mice. ND, Not detected; CA, cholic acid; α-MCA, α-muricholic acid; β-MCA, β-muricholic acid; TCA, tauro-cholic acid; TCDCA, tauro-chenodeoxycholic acid; Tα-MCA, tauro-α-muricholic acid; Tβ-MCA, tauro-β-muricholic acid; TUDCA, tauro-ursodeoxycholic acid; TDCA, tauro-deoxycholic acid; ω-MCA, ω-muricholic acid. CDCA, DCA, lithocholic acid (LCA), and TLCA were undetected. Data are presented as mean ± SEM, * p < 0.05, ** p < 0.01, *** p < 0.001 vs. C26.

