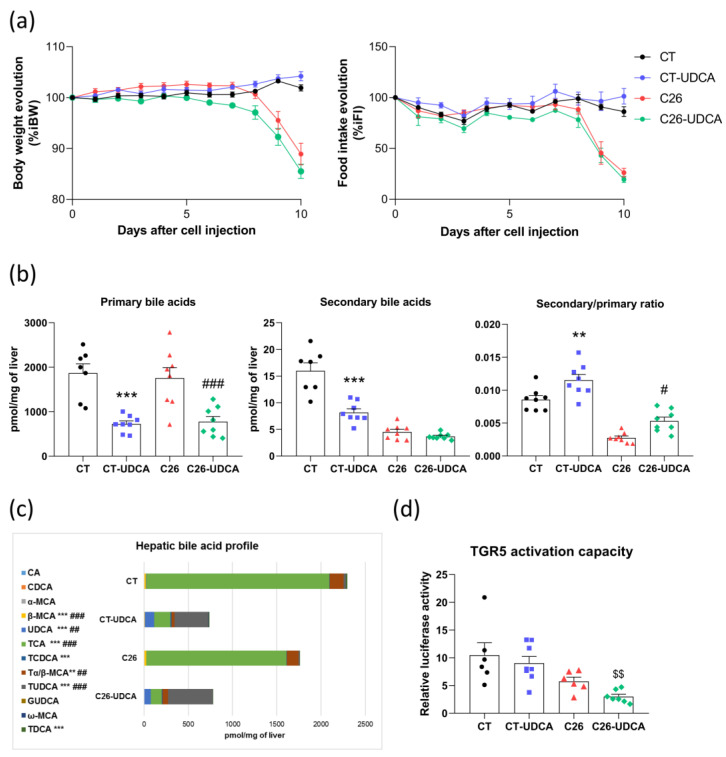
Figure 4.
UDCA treatment changes the bile acid profile and decreases TGR5 activation capacity in C26 cachectic mice. (a) Body weight and food intake evolution in sham-injected mice (CT), sham-injected mice treated with UDCA (CT-UDCA), mice injected with cachexia-inducing C26 colon carcinoma cells (C26), and mice injected with cachexia-inducing C26 colon carcinoma cells and treated with UDCA (C26-UDCA). (b) Primary and secondary bile acid levels and Secondary/primary ratio in the liver of CT, CT-UDCA, C26, and C26-UDCA mice. (c) Hepatic bile acid profile in CT, CT-UDCA, and C26 and C26-UDCA mice. (d) TGR5 activation capacity using cell reporter assay incubated with portal plasma of CT, CT-UDCA, C26, and C26-UDCA mice. n = 5–8 mice per group; data are presented as mean ± SEM. ** p < 0.01, *** p < 0.001 CT vs. CT-UDCA and # p < 0.005, ## p < 0.01, ### p < 0.001 C26 vs. C26-UDCA. Student t-test C26 vs. C26-UDCA, $$ p < 0.01.

