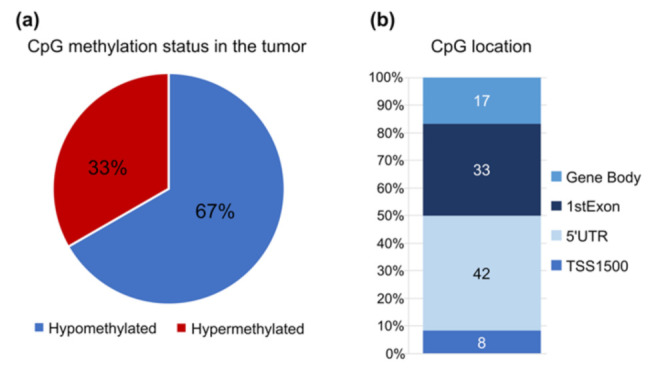
Figure 1.

Methylation pattern and genome location of the 12 CpGs in study using the TCGA PCA cohort. (a) % of CpGs hypomethylated (blue) and hypermethylated (red) in tumor samples compared to the control. (b) Distribution of the 12 probes for the Infinium HumanMethylation450. TSS1500, probes located within 1500 base pairs from the transcription start site (TSS); 5′UTR, 5′ untranslated region.
