
Figure 5.
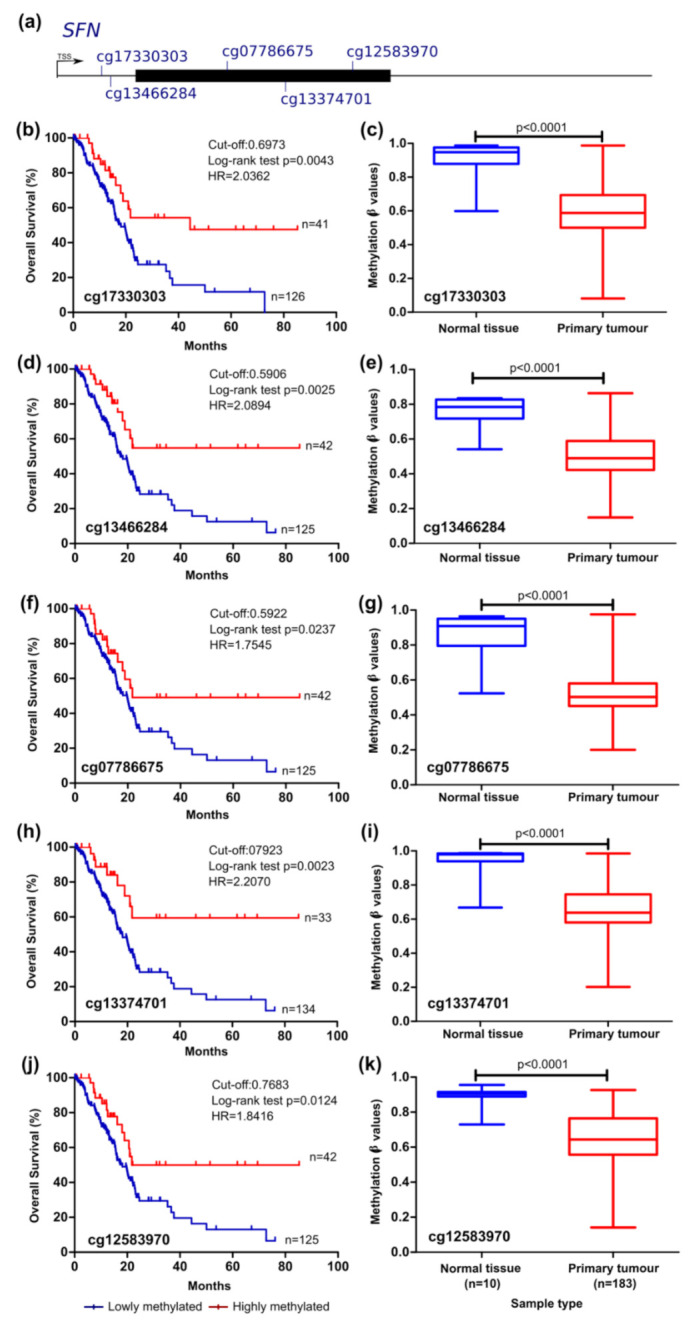
SFN methylation can predict survival in the TCGA pancreatic cancer cohort. (a) Probe location within the gene is shown (scheme is at scale). Kaplan–Meier curve for OS (log-rank test) (b,d,f,h,j) and comparison between normal and tumour tissue (mean ± SD; Mann–Whitney test) (c,e,g,i,k) considering the methylation levels of the probes cg17330303, cg13466284, g07786675, cg13374701, and cg12583970. Cut-off values for Kaplan–Meier curves and sensitivity and specificity values were, respectively, 0.6973 (75.15% and 87.50%); 0.5906 (75.15% and 87.50%); 0.5922 (75.15% and 87.50%); 0.7923 (80.47% and 87.50%); 0.7683 (75.15% and 87.50%). Patients with methylation levels inferior and superior to the cut-off were considered as lowly and highly methylated, respectively. HR, hazard ratio.