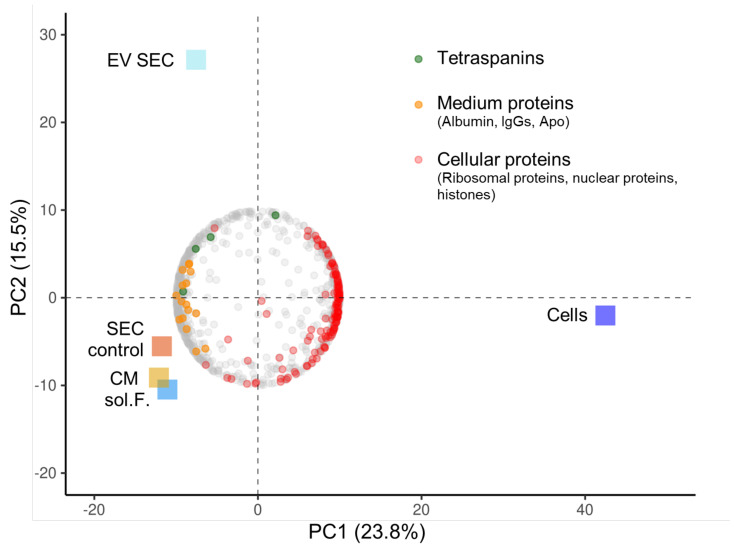
Figure A3.
Tandem mass tag proteomics of AML EV fractions. Principle component (PC) analysis biplot showing clustering of the different samples (squares) and the loadings of the 906 variable proteins (circular dots; representing the weights for each original variable—here proteins—when calculating the PC). PC1 showed the strongest separation between cells and other samples (23.8% variance explained) while PC2 separated the size exclusion chromatography-enriched KG1-EVs (EV SEC) from other samples (15.5% variance explained). Protein-rich SEC fraction (SEC control), conditioned media (CM) and soluble factors (sol. F.) were the most similar samples. Individual loadings showed enrichment of tetraspanins (green circles) in the EV SEC fraction. KG1 cells were enriched for cellular proteins (red circles; including histones, ribosomal and nuclear proteins). The cluster “SEC control/CM/sol. F.” was enriched for presumably culture medium-derived proteins (orange circles; albumin, IgGs and apolipoproteins). Five KG-1-derived sample fractions as indicated by colored boxes; mean data, fractions analyzed in duplicate.

