Figure 5.

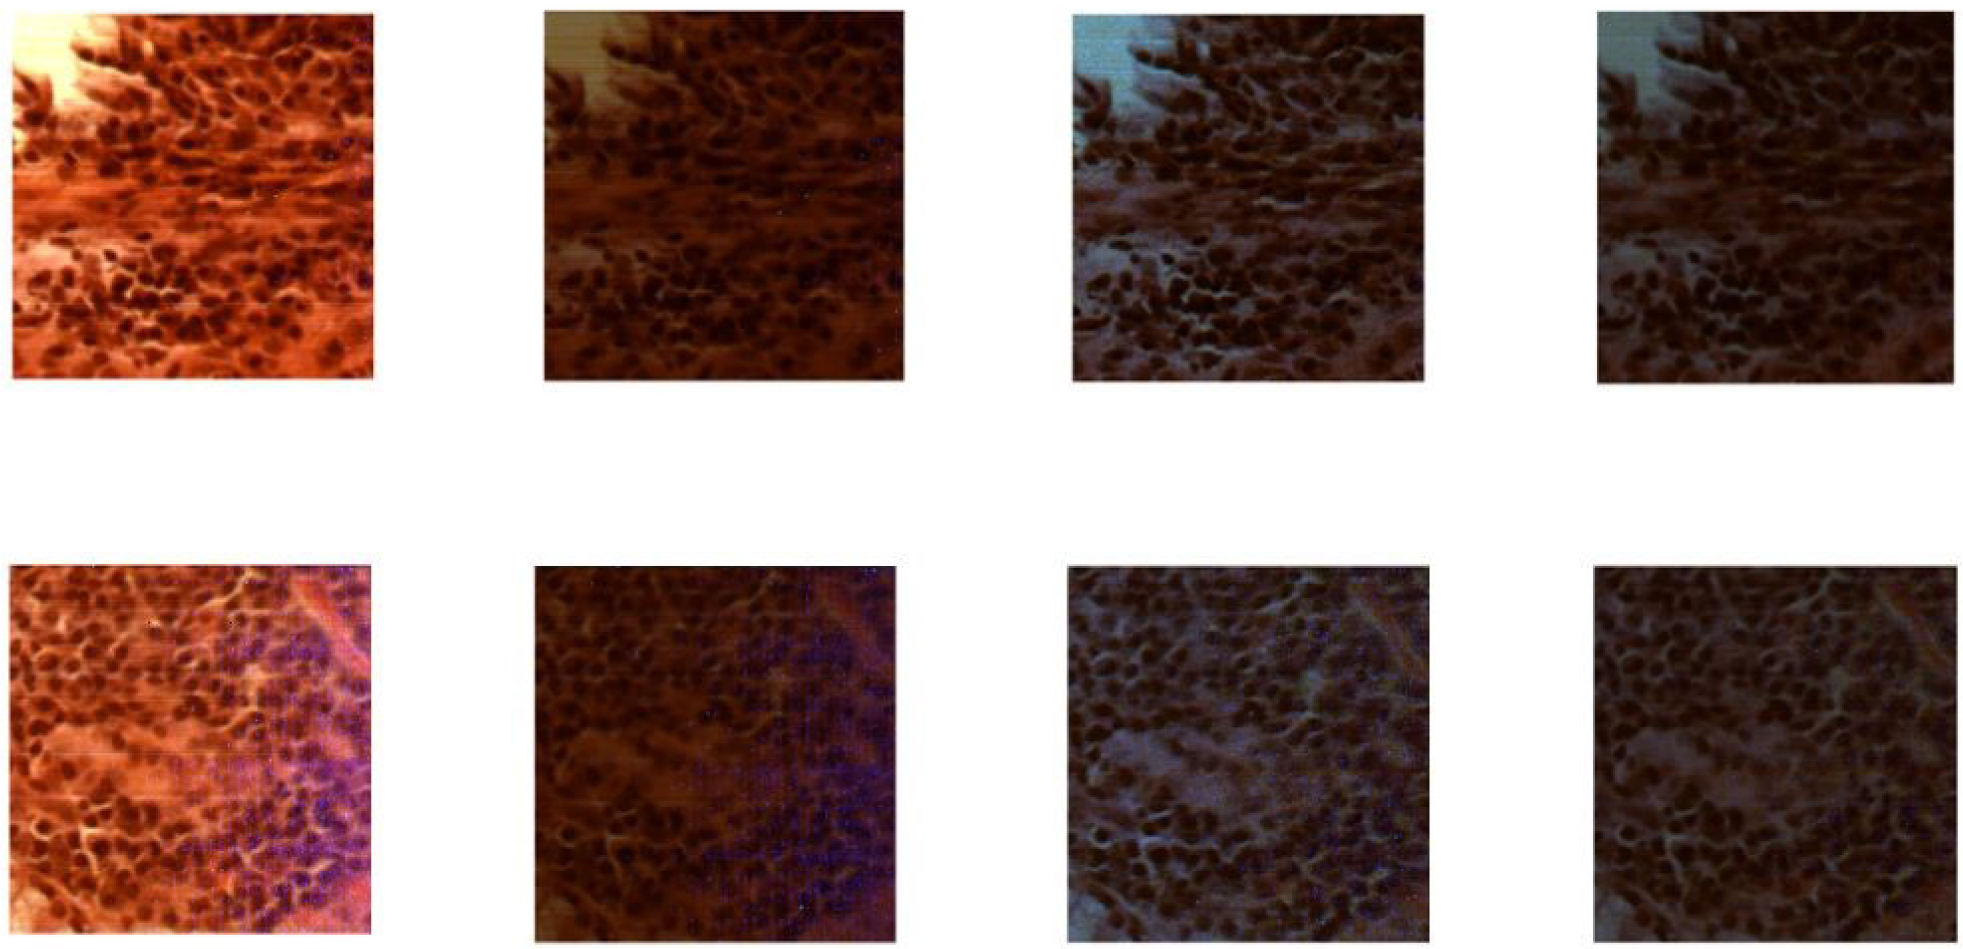
The color image representation of S0, S1, S2, and S3 (left to right) from a normal area on the normal slide (top) and a cancerous area on the tumor slide (bottom) of the same patient.

The color image representation of S0, S1, S2, and S3 (left to right) from a normal area on the normal slide (top) and a cancerous area on the tumor slide (bottom) of the same patient.