
Figure 5.
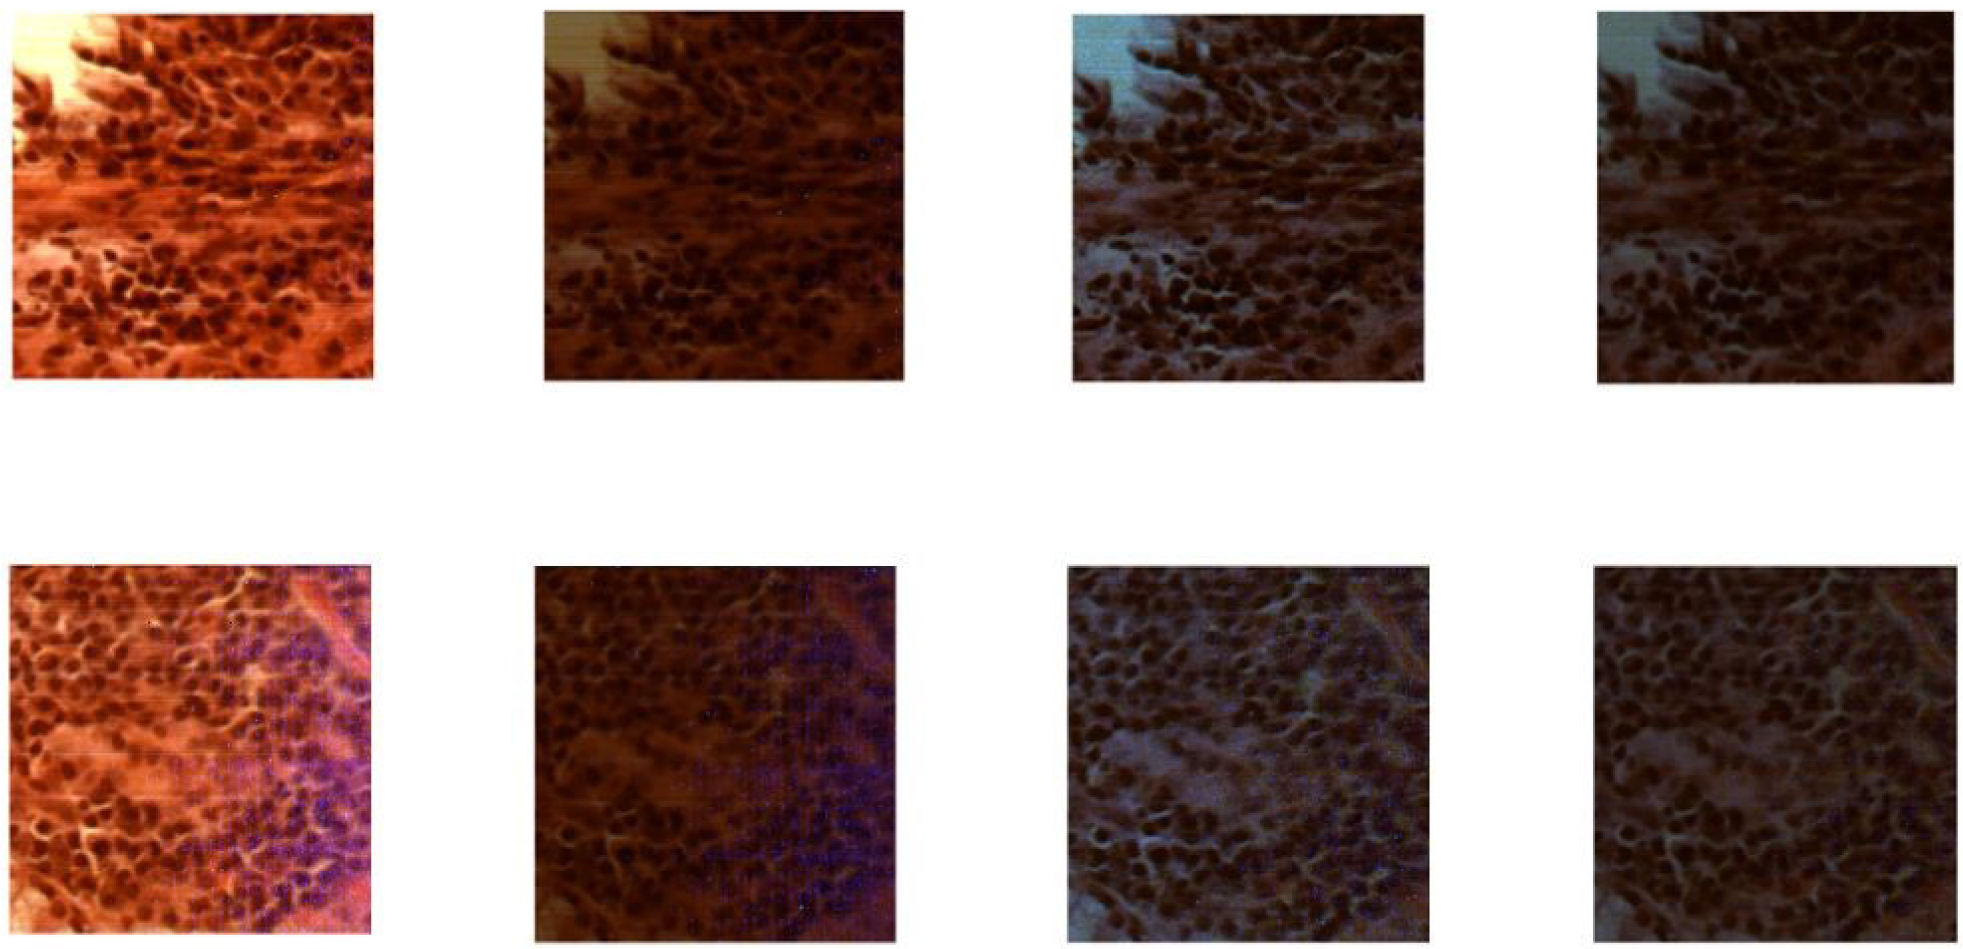
The color image representation of S0, S1, S2, and S3 (left to right) from a normal area on the normal slide (top) and a cancerous area on the tumor slide (bottom) of the same patient.
Official websites use .gov
A
.gov website belongs to an official
government organization in the United States.
Secure .gov websites use HTTPS
A lock (
) or https:// means you've safely
connected to the .gov website. Share sensitive
information only on official, secure websites.
The color image representation of S0, S1, S2, and S3 (left to right) from a normal area on the normal slide (top) and a cancerous area on the tumor slide (bottom) of the same patient.