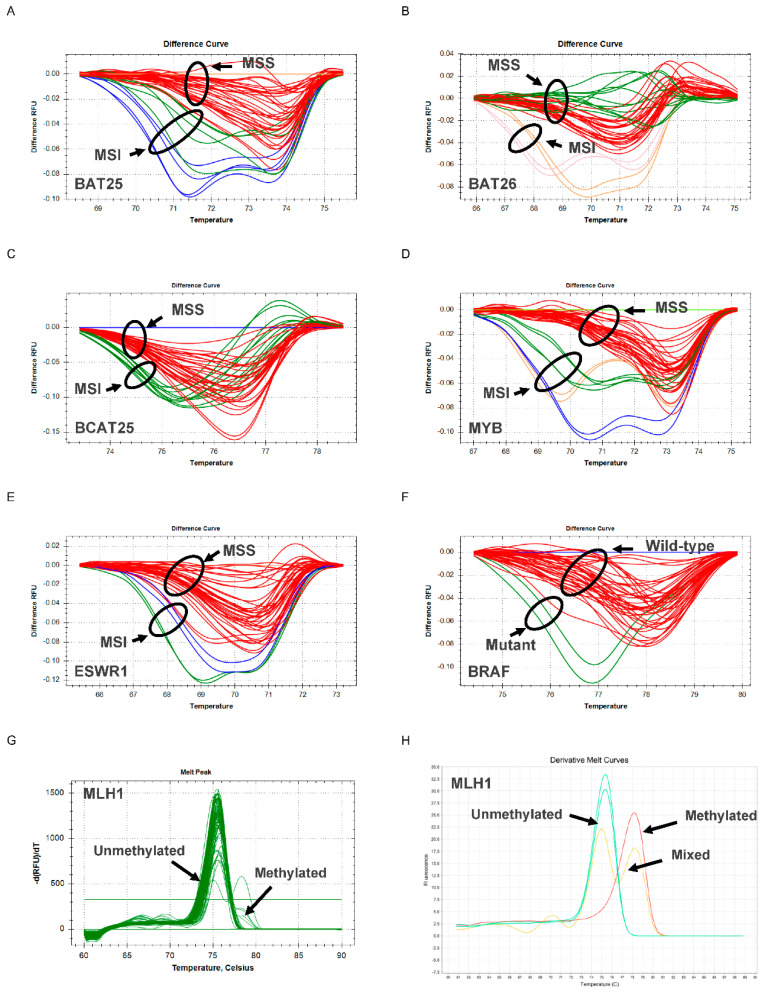
Figure 1.
Use of the N_LyST panel to screen for Lynch syndrome. Differential plots are shown for 5 microsatellite markers BAT25 (A), BAT26 (B), BCAT25 (C), MYB (D), and EWSR1 (E). The differential melt curves of the tumours with microsatellite instability (MSI) and those that are microsatellite stable (MSS) are indicated by the distinct black circles. The differential melt curves of the tumours with wild-type BRAF are different from those with mutant BRAF, as indicated by respective black circles (F). Derivative plots are shown for the CpG Island region C of MLH1 for tumour samples (G) and human DNA control (H). For tumour samples, two discrete melting forms are shown: ‘methylated’, comprising two melting peaks that represent methylated DNA (from tumour epithelium) and non-methylated DNA (from tumour stroma) or ‘non-methylated’, comprising one melting peak that characterises a completely non-methylated tumour and stroma cell population.

